ABSTRACT
Electro discharge machining (EDM) is one of the most frequently used processing methods for machining conductive materials. Taguchi method combined with Grey relational method has been used to accommodate requests for multiple object functions in the EDM process. In the present study, an attempt was made to determine optimum parameters for minimum size of hole and number of shots. The size of the hole is related to the quality of the hole while the number of shots affects machining time. Grey relational analysis was used to determine optimal machining parameters. Electrode length and unit discharge were found to be the most significant parameters. Optimal conditions were: pulley position of 39 mm, voltage of 120 V, a capacitance of 1500 pF, and a resistance of 500 Ω. In experiments, such electrical conditions (voltage, capacitance, and resistance) generated electrical energy of 10 μj. Under these conditions, a micro hole of 184.9 μm in average diameter could be machined with 16 shots.
-
KEYWORDS: Micro-Electro discharge machining, Grey relational analysis, Taguchi method
-
KEYWORDS: 미세방전가공, 그레이 관계분석, 다구치 방법
NOMENCLATURE
Effective number of experiments
Grey relational coefficient
1. 서론
방전가공(Electro Discharge Machining, EDM)은 다방면으로 사용되는 특수가공 방법 중의 하나이다. 일반적으로 직접 접촉에 의한 기계적 절삭 방식을 이용하는 선삭, 밀링, 드릴링 등의 기존의 가공방식들은 가공 정밀도가 높고 동시에 빠른 속도로 가공할 수 있지만 이를 구현하기 위해서는 정적, 동적 구속조건에 따른 많은 제약 조건이 뒤따른다. 또한 가공에 필요한 마이크로 공구제작의 어려움은 마이크로 크기의 가공물 제작을 더욱 어렵게 만든다. 방전가공은 전극을 음극, 가공물을 양극으로 설정하고 방전을 일으켜 이때 발생하는 열에너지에 의해 가공물이 용융되어 가공되는 방법이다. 공작물이 전기 전도 특성이 있으면 경도와 인성에 관계없이 고경도의 소재도 가공이 가능하며 가공 반력이 매우 작아 미세 가공이 가능하여 설계의 유연성이 크다. 최근 산업제품은 소형화와 경량화 추세로 인해 미세형상 가공이 기본이 되며 방전가공은 수 십 분의 1마이크로미터 정도의 가공 정밀도로 가공이 가능하기 때문에 마이크로 펀치용 다이, 잉크젯 노즐, 핵융합측정장치, X-ray 전자총, 고속 컴퓨터의 마이크로 연결부, 마이크로 터빈, 항공기 엔진부, 광학부품 등에서 미세 가공의 수요가 점점 높아지고 있다.
1,2 마이크로 전국을 이용한 미세 방전가공 시 공정 파라미터를 최적화하여 구멍의 직경을 줄일 수 있다. 다구치 방법(Taguchi Method)은 이러한 최적 파라미터를 결정하기 위해 여러 산업분야에서 이용되는 방법이다. 제품의 품질특성에 변동을 초래하는 여러 교란 요인들에 대해 직접적인 조치를 취하는 대신 이들에 둔감한 공정조건을 찾음으로써 품질변동을 감소시키는 방법이다.
3 그러나 다구치 방법은 1개의 품질 특성만 최적화 시키는 제한이 있는데 이를 극복하기 위하여 그레이 상관관계분석(Grey Relational Analysis)을 사용하였다. 그레이 상관관계분석이란 1982년 Deng에 의해 처음으로 소개되었던 Grey System 이론에서 파생된 것으로 목표치에 근거한 실험 결과의 경향을 예측하기 위한 새로운 분석법이다.
4 이 분석법은 통계상의 두 개 이상의 연속물에 대한 수치상의 상관관계를 파악하여 EDM 공정의 여러 개의 품질특성을 만족시키는 방법으로 이를 다구치 방법과 결함하면 1개의 품질 특성만 최적화하는 단점을 극복할 수 있다.
본 연구의 목적은 마이크로 EDM 가공 시 주어진 가공 조건하에서 최소 직경을 갖는 미세 구멍을 가장 적은 수로 가공하기 위한 최적 파라미터를 결정하는 것이다. 둘 이상의 목적함수를 만족하는 최적조건 결정 방법은 본 저자에 의하여 개발 되었다.
5 이 연구에서는 이전 연구와는 달리 구매가 용이한 구리전극을 사용하였으며 다구치 방법을 통해 각 가공파라미터가 EDM 공정에 미치는 영향을 파악하고, 그레이 상관관계분석을 통해 정밀도를 유지하면서 생산성을 높이는 최적의 공정 파라미터를 결정하였다.
2. EDM을 이용한 미세 구멍 가공
2.1 실험 장치
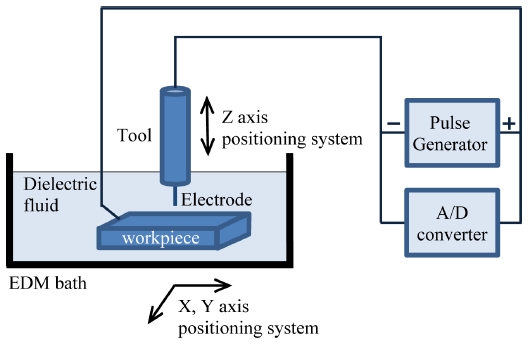
본 연구에서는 자체적으로 제작된 EDM 실험 장치가 사용되었다. 컨트롤러로는 Delta Tau사의 CLIPPER T2가 사용되었고 Parker Hannifin사의 ZETA57-83-MO linear DC 모터를 사용하여 X, Y, Z 축의 변위제어를 하였다. 또한 Z축 회전은 반경방향 회전 정밀도 0.05 μm 이내, 최대 회전수가 3,000 rpm인 Animatics사의 SmartMotor SM2315D DC 서보모터를 이용하여 회전시켰다. Z축 회전 DC 서보 모터에 샤프트를 연결하여 베어링으로 고정시켰다. 또한 샤프트 중간에 장착한 풀리에 폴리우레탄 원형 벨트를 연결하여 전극을 회전시켜 가공 과정에서 발생하는 파편의 배출을 원활하게 하였다. 방전회로는 입력전압과 Capacitor의 용량으로 단발 방전 에너지를 쉽게 조절할 수 있는 RC 방전 회로를 사용하였다.
6 전극의 소모를 적게 하고 시편의 가공 속도를 높이기 위해 시편을 +, 전극을 –로 두는 정극성 가공 조건으로 실험을 진행한 EDM 실험 장치가
Fig. 1에 보여졌다.
Fig. 1Schematics of experimental set up for EDM

2.2 구멍 가공
본 연구에서는 직경 300 μm의 구리 전극과 두께 500 μm의 스테인레스강(STS304) 시편을 사용하여, 이송속도 1.0 μm/s, 회전속도 2,200 rpm으로 시편을 관통할 때까지 실험하였다. 절연 액으로는 비전도유체인 등유를 사용하였다. 등유를 절연 액으로 사용하면, 전극의 길이 방향 마모가 탈 이온수를 사용했을 때의 2배가 된다.
7 그러나 등유를 사용하면 탈 이온수를 사용했을 때 보다 입구간극이 작아지기 때문에 본 실험에서 미세구멍 가공에 사용하였다. 방전가공에서 가공과정 중 전극이 시편에 닿으면 전류가 회로에 흐르게 되며 이는 스파크가 유도되지 않았음을 의미한다. 이 때 전극과 시편 사이의 전압을 측정하여 기계의 z축은 후퇴하여 간격을 만들게 되는데 이 횟수를 쇼트수라고 한다. 쇼트수가 높으면 가공 속도가 z축으로의 이동 속도를 쫓아가지 못하는 것이므로 쇼트수가 낮을수록 좋다. 가공이 완료된 후, 전극의 마모 길이는 시편의 가공되지 않은 표면에 접촉하여 가공 전후 z축의 차이를 계산하여 측정하였으며 쇼트 수, 입구간극을 측정하였다.
이 실험에서 반지름과 쇼트 수를 목적 함수로 두고 실험을 진행하였다. 반지름은 가공 후 시편에 가공된 구멍의 반지름이다. 반지름과 쇼트 수 모두 작을수록 좋은 망소 특성이다. 제어 인자는 3가지로 설정하였다. 첫 번째 제어인자인 풀리 위치에 따라 원형 벨트의 장력이 달라지므로 풀리 위치를 제어 인자로 선정하였다. 풀리 위치는 34.5 mm, 36 mm, 37.5 mm, 39 mm 4 수준으로 설정하였다. 풀리 위치는
Fig. 2에서 볼 수 있듯이 콜릿의 끝단에서 풀리까지의 거리를 의미한다. 두 번째로는 전극의 길이이다. 전극의 길이는 전극을 고정시키는 콜릿 밖으로 돌출 되어 있는 길이인데 구리 전극의 경우 연성이 높기 때문에 전극이 길면 휘어지게 되어 공정에 영향을 많이 미칠 것으로 판단되어 제어인자에 포함하였다. 구리 전극의 길이는 10 mm, 15 mm 2 수준으로 설정하였다. 마지막 제어 인자는 실험 조합이다. 실험 조합은 Voltage의 차이에 따른 단발 방전 에너지의 차이가 있다. 단발 방전 에너지가 크면 그만큼 단발 방전 당 가공되는 시편의 양이 많고 쇼트 수가 감소할 것으로 예상된다. 하지만 그만큼 반지름의 크기가 커질 수 있으므로 이번 실험의 인자로 선정하였다. 정전용량과 저항은 고정 값으로 선정한 실험 조합이
Table 1에 주어졌다. 결과적으로 이 실험조합은 단발 방전 에너지를 조절하는 제어인자가 된다.
Fig. 2Schematics of the rotating main spindle for EDM
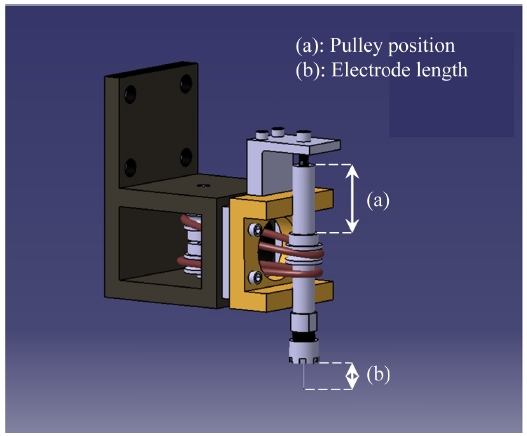
Table 1Experiment combination for control factor
Table 1
|
No. |
Voltage
(V) |
Capacitance
(pF) |
Resistance
(Ω) |
Unit discharge
energy (μJ) |
|
1 |
100 |
1500 |
500 |
7.5 |
|
2 |
120 |
1500 |
500 |
10 |
풀리 위치, 전극 길이, 실험 조합의 3가지 제어인자를 L8
Table 2에 배치하여 8번의 실험 조건을 생성한 후 실험을 진행하였다. 각 실험조건에서 실험을 각각 3번 수행하였으며 평균값을 구한 후 평균값을 이용하여 분석을 실시하였다.
Table 2L8 Experimenter’s log
Table 2
|
Pulley position
(mm) |
Electrode length
(mm) |
Experimental
condition
(from Table 1) |
|
1 |
34.5 |
15 |
No.1 |
|
2 |
34.5 |
10 |
No.2 |
|
3 |
36 |
15 |
No.1 |
|
4 |
36 |
10 |
No.2 |
|
5 |
37.5 |
15 |
No.2 |
|
6 |
37.5 |
10 |
No.1 |
|
7 |
39 |
15 |
No.2 |
|
8 |
39 |
10 |
No.1 |
3. 실험 및 결과
3.1 결과 및 ANOVA
3.1.1 실험 결과
각 실험은 최소 직경을 갖는 최적조건을 구하기 위해서 실행되었으므로 S/N비는 망소특성을 나타내는 다음의 식으로 표시된다.
각각의 실험조건과
식(1)을 이용하여 구한 반지름과 쇼트 수의 결과 값에 대한 S/N비가
Table 3에 주어졌다.
Table 3Experimental results of shot number and radius
Table 3
|
Pulley position
(mm) |
Electrode length
(mm) |
Experimental
condition
(No.) |
Shot number |
Radius |
S/N Ratio for
shot number |
S/N Ratio for
radius |
|
1 |
34.5 |
15 |
1 |
12.7 |
214.8 |
-22.1 |
-46.6 |
|
2 |
34.5 |
10 |
2 |
21.3 |
195.0 |
-26.6 |
-45.8 |
|
3 |
36 |
15 |
1 |
16.3 |
226.9 |
-24.3 |
-47.1 |
|
4 |
36 |
10 |
2 |
27.3 |
194.2 |
-28.7 |
-45.8 |
|
5 |
37.5 |
15 |
2 |
21.7 |
203.4 |
-26.7 |
-46.1 |
|
6 |
37.5 |
10 |
1 |
27.7 |
193.1 |
-28.8 |
-45.7 |
|
7 |
39 |
15 |
2 |
8.7 |
204.8 |
-18.8 |
-46.2 |
|
8 |
39 |
10 |
1 |
22 |
198.4 |
-26.6 |
-46.0 |
3.1.2 S/N비의 ANOVA
Table 4에는 쇼트 수의 실험결과에 대한 분산 분석이 주어졌다.
Table 4에서 쇼트 수의 F 값을 보면 10.4의 값을 가진 전극 길이가 가장 영향을 크게 미치는 것을 알 수 있다. 풀리 위치는 2.2의 F 값으로 비교적 적은 영향을 미치며 실험 조합은 0.04의 F 값을 보여 쇼트 수에 영향을 거의 주지 않는 것을 알 수 있다. 결과적으로 쇼트 수에 가장 영향을 많이 미치는 파라미터는 전극의 길이이고 두번째 영향을 미치는 것은 풀리의 위치이다. 반지름의 분산 분석은
Table 5에 보여졌다.
Table 5에서 전극의 길이가 미세구멍의 반경에 가장 큰 영향을 미치고 다음은 실험 조합, 그리고 풀리의 위치 순으로 영향을 미치는 것으로 밝혀졌다. 전극의 길이가 길어질수록 미세구멍의 반경은 커지고 짧을수록 반경이 작아지는 경향을 보였는데 구리 전극의 유연성 때문에 미세구멍 반경에 가장 큰 영향을 미친 것으로 분석된다.
Table 4Analysis of variation for shot number data
Table 4
|
Experimental factor |
DOF |
Sum of
squares |
Mean
square |
F |
|
Pulley position |
3 |
29.52 |
9.84 |
2.2 |
|
Electrode length |
1 |
46.12 |
46.12 |
10.4 |
|
Experimental condition |
1 |
0.18 |
0.18 |
0.04 |
|
Error |
2 |
8.90 |
4.45 |
|
|
Sum |
8 |
84.72 |
|
|
Table 5Analysis of variation for radius data
Table 5
Experimental
factor |
DOF |
Sum of
squares |
Mean
square |
F |
|
Pulley position |
3 |
0.27 |
0.09 |
2.48 |
|
Electrode length |
1 |
1.06 |
1.06 |
29.52 |
|
Experimental condition |
1 |
0.27 |
0.27 |
7.39 |
|
Error |
2 |
0.07 |
0.04 |
|
|
Sum |
8 |
1.67 |
|
|
3.2 신뢰한계 2σ와 확인실험
3.2.1 최적 조건 및 최적 조건에서 S/N비 예측
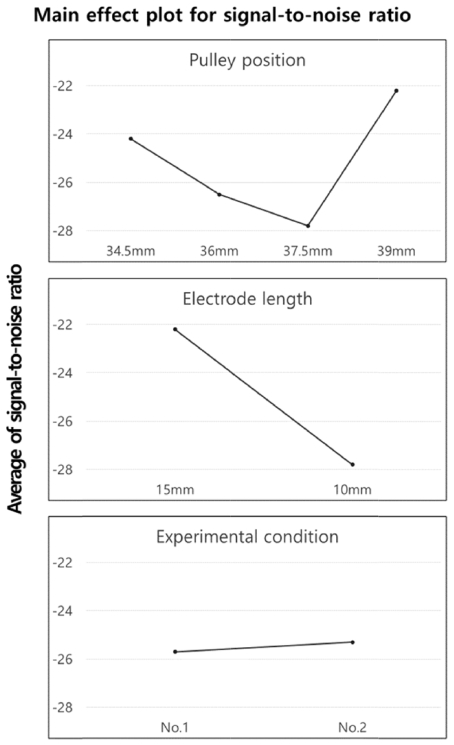
풀리위치, 전극길이, 실험조건의 각 수준별 S/N비를 이용하여 쇼트수가 가장 적을 때의 최적조건을
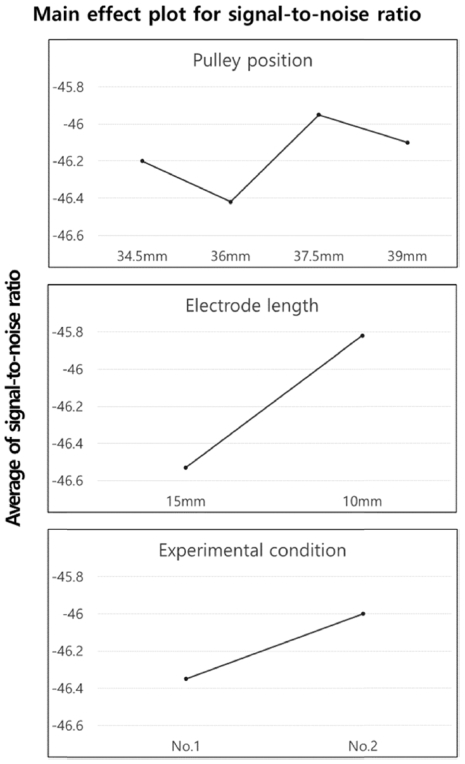
Fig. 3에서 구해보면 풀리 위치는 39 mm, 전극 길이는 15 mm, 실험 조합은 2번 조건일 때이다. 또한 반지름을 최소화하는 최적조건을
Fig. 4에서 구하면 풀리 위치 37.5 mm, 전극 길이 10 mm, 실험 조합은 2번 조건일 때이다. 가법 모델을 이용하여 위의 최적 조건에서의 S/N비를 예측하면 쇼트 수의
η값은 -20.25이고, 반지름의
η값은 -45.39이다. 이렇게 예측된 값이 실제 실험값과의 유사성에 따라 가법모델이 타당할 수도 있고 그렇지 않을 수도 있다. 만일 실험값과 예측 값의 차이가 크다면 특성함수와 파라미터의 선정, 파라미터의 수준 등이 잘못 결정된 것이므로 새로운 특성함수의 선정, 그리고 수준값들의 변경 등이 필요하다. 가법모델이 적절한가를 판정하기 위해서 확인실험을 수행하고 신뢰한계를 구한 후, 가법모델과 실험결과가 신뢰한계 내에 포함되는지를 조사하였다.
Fig. 3S/N ratio for each factor of shot number

Fig. 4S/N ratio for each factor of radius

3.2.2 신뢰한계
가법모델로 예측된 결과의 신뢰성을 확인하기 위하여 신뢰한계범위
σ를 구하였다.
σ를 구한 후 예측결과와 실험결과가 ±2
σ를 범위 안에 들어오면 가법모델이 적합하다고 판단한다.
σ는 다음 식으로 구한다.
8
여기서
σe2은 오차의 평균 제곱,
n0는 유효 실험 수이고
nr은 확인 실험 수이다. 확인 실험 수는 3 회이므로
식(3)에 의하여 유효실험 수
n0=1 로 계산된다. 따라서
σpred2=4σe2/3이다. 쇼트 수의 경우
σpred2 =5.93, 2
σpred = ±4.87이 된다. 이 값을 최적 수준 S/N비에 더하여 신뢰 범위를 구하면 -15.38 dB ~ -25.16 dB이 되는데 이를
식(1)을 이용하여 쇼트 수로 변환하면 2
σ 신뢰 한계에서 쇼트 수의 범위는 5.88 - 18.03이다.
반지름의 경우
σpred2 =0.0481, 2
σpred = ±0.4386이 된다. 이 값을 최적 수준 S/N비에 더하여 신뢰 범위를 구하면 -45.83 dB ~ -44.96 dB이 되는데 이를
식(1)을 이용하여 쇼트 수로 변환하면 2
σ 신뢰 한계에서 반지름의 범위는 176.93 - 195.73 μm이다.
3.2.3 최적 조건에서 확인 실험
예측된 신뢰범위 내에 실제 실험결과가 포함되는 지 여부를 확인하기 위하여 최적 조건에서 3번의 실험을 행한 후 결과가
Table 6에 주어졌다. 결과를 살펴보면 쇼트 수는 16번으로 ±2
σ범위인 5.88 - 18.03 내에 포함되고, 반지름도 184.9 μm로 ±2
σ범위인 176.93 - 195.73 μm 내에 포함된다. 따라서 가법성이 만족되므로 파라미터가 적절하게 선정되어 교호작용이 없고, 그 수준과 품질함수도 적절한 것으로 판단되었다.
Table 6Number of shots and radius at optimum conditions
Table 6
|
No. 1 |
No. 2 |
No. 3 |
Average |
|
Shot number |
14 |
15 |
19 |
16 |
|
Radius (μm) |
184.9 |
178.0 |
191.7 |
184.9 |
3.3 그레이 관계 분석
3.1과 3.2에서 반지름과 쇼트 수를 독립적으로 분석하고 최적 수준을 결정하고 그 값이 ±2 σ 범위 내에서 신뢰할 수 있음을 보였다. 하지만 쇼트수를 최적화 하기 위한 최적조건은 풀리 위치 39 mm, 전극 길이 15 mm, 실험 조합은 2번 조건이고, 반지름을 최적화 하기 위한 최적조건은 풀리 위치 37.5 mm, 전극 길이 10 mm, 실험 조합은 2번 조건으로 서로 다르다. 이는 쇼트수를 최적화하면 반지름이 최적화되지 않고, 반지름을 최적화하면 쇼트수가 최적화 되지 않는다는 뜻이다. 이를 극복하기 위하여 그레이 관계분석(Grey Relational Analysis)를 이용한다. 이 방법은 두 가지의 목적 함수에 가중치를 부여하여 쇼트 수와 반지름을 동시에 만족하는 조건을 구하는 것이다. 이를 위하여 그레이 관계 계수와 등급을 구한다.
3.3.1 그레이 관계분석
그레이 관계분석은 망대 특성일 경우와 망소특성, 망목 특성에 따라 그레이 관계 계수를 구하는 방법이 다르다.
망대 특성, 즉 클수록 좋은 경우의 그레이 관계 계수를 구할 때 사용되는
xi*(
k)값은 다음과 같다.
4
망소 특성, 즉 작을수록 좋은 경우는
망목 특성의 경우에는 다음 식으로 주어진다.
여기서 OB는 목표 값이다.
3.3.2 그레이 관계계수 및 그레이 관계 등급
그레이 관계 계수(Grey Relational Coefficient)는
식(7)과
식(8)과 같이 정의된다.
4
여기서 Δoi(k)는 다음과 같이 정의 된다.
ξ는 Distinguishing Coefficient이고 범위는 ξ ∈ [0,1]이다.
그레이 관계 등급은 다음의 식으로 구해진다.
3.3.3 그레이 관계계수 및 등급 평가
그레이 관계 계수 및 등급을 구하기 위하여
Table 8의 각 실험조건에서 얻어진 쇼트 수와 반지름을 크기를
식(5)(망소 특성)에 의하여 정규화하였고 그 결과를
Table 7에 제시하였다. 이 값들과
식(7)과
식(12)를 이용하여 그레이 관계 계수와 그레이 관계 등급을 구한 결과가
Table 8에 주어졌다. 이때 쇼트 수보다는 최소 반경이 더 중요하다고 생각하여 쇼트 수는 0.4, 최소반경에 0.6의 가중치를 주어 계산했다. 가중치는
식(13)의 b값에 해당하며 이 값들의 합은 1이 되어야 한다. 이렇게 얻어진 그레이 관계 등급을 이용하여 분산 분석을 실시하였고 그 결과를
Table 9에 보여졌다.
Table 7Experimental result after normalization process
Table 7
|
Shot number |
Radius
(μm) |
|
1 |
0.789 |
0.359 |
|
2 |
0.333 |
0.945 |
|
3 |
0.596 |
0 |
|
4 |
0.018 |
0.966 |
|
5 |
0.316 |
0.694 |
|
6 |
0 |
1 |
|
7 |
1 |
0.652 |
|
8 |
0.298 |
0.843 |
Table 8Calculated Grey relational coefficient and grade
Table 8
|
Grey relational coefficient |
Grey relational
grade |
|
Shot number |
Radius |
|
1 |
0.704 |
0.438 |
0.544 |
|
2 |
0.429 |
0.902 |
0.712 |
|
3 |
0.553 |
0.333 |
0.421 |
|
4 |
0.337 |
0.937 |
0.697 |
|
5 |
0.422 |
0.621 |
0.541 |
|
6 |
0.333 |
1.000 |
0.733 |
|
7 |
1.000 |
0.590 |
0.754 |
|
8 |
0.416 |
0.761 |
0.623 |
Table 9Analysis of variation for Grey relational grade
Table 9
|
1 |
2 |
3 |
4 |
DOF |
Sum of squares |
Mean square |
F |
|
Pulley position* |
0.628 |
0.559 |
0.637 |
0.689 |
3 |
0.017 |
0.006 |
- |
|
Electrode length |
0.565 |
0.692 |
|
|
1 |
0.032 |
0.032 |
3.469 |
|
Experimental condition |
0.581 |
0.676 |
|
|
1 |
0.018 |
0.018 |
1.991 |
|
Error |
|
|
|
|
5 |
0.046 |
0.009 |
|
|
Sum |
|
|
|
|
7 |
0.096 |
|
|
3.3.4 그레이 관계 등급의 ANOVA
Table 8에서 계산된 그레이 관계 등급을 이용하여 분산분석을 수행한 후
Table 9에 보여졌다. 분석결과 반지름과 쇼트 수에 각각 0.6, 0.4의 가중치를 주었을 때 가장 큰 영향을 미치는 파라미터는 F 값이 3.469인 전극의 길이이고 두 번 째로 F값이 1.991인 실험조합이 영향을 미치는 것을 알 수 있다. 풀리 위치의 제곱평균값 이 실험조합의 1/3정도이므로 큰 영향을 주지 않는다고 판단하여 오차로 풀링하여 진행하였다. 최적조건은 전극 길이 10 mm, 실험 조합 2번 조건일 때로 밝혀졌다. 이 최적조건은 반지름을 최적화하는 조건과 동일하다. 즉 반지름에 60%의 가중치, 쇼트 수에 40%의 가중치를 주었을 때도 반지름만을 최적화하였을 때와 동일한 결과를 얻었다. 이는 3.2.3에서 확인된 바와 같이 쇼트수의 허용 범위는 비교적 넓고 반지름의 허용 범위가 상대적으로 좁아서 반지름이 만족되면 쇼트 수는 큰 문제없이 만족되기 때문으로 분석된다.
4. 결론
본 연구에서는 가능한 한 작은 구멍을 가공하면서 생산성을 극대화하는 최적의 가공조건을 찾기 위해 실험을 한 결과 다음과 같은 결과를 얻었다.
유연성이 높은 구리 전극을 이용하여 0.5 mm 두께의 스테인레스 박판을 가공할 때, 다구치 방법을 이용하여 풀리 위치, 전극길이, 실험조건에 따른 단발방전에너지가 가공 파라미터에 미치는 영향을 분석하였다. 쇼트 수의 경우 풀리 위치는 39 mm, 전극 길이는 15 mm, 실험 조합은 2번 조건이 최적의 수준이고, 반지름의 경우 풀리 위치는 37.5 mm, 전극 길이는 10 mm, 실험 조합은 2번 조건이 최적의 수준으로 분석되었다. 2개의 파라미터를 최적화하기 위해 그레이 상관 관계 분석법(Grey Relational Analysis)을 사용하였다. 반지름과 쇼트 수에 각각 0.6, 0.4의 가중치를 주어 그레이 상관관계 등급을 구하였다. 그레이 상관관계 분석법으로 구한 결과 풀리 위치는 큰 영향을 주지 않는다고 판단되었고 전극 길이가 가장 큰 영향을 주고 그 다음으로 실험 조합이 영향을 주었다. 쇼트와 반지름을 동시에 최적화하는 실험 조건은 반지름을 최적화하는 실험 조건과 동일함이 밝혀졌다.
REFERENCES
- 1.
Seo, D.-W., Yi, S.-M., Chu, C.-N., and Park, M.-S., “Machining Characteristics of Micro-EDMed Holes according to Dielectric Fluid, Capacitance and Ultrasonic Vibrations,” Journal of the Korean Society for Precision Engineering, Vol. 24, No. 12, pp. 42-49, 2007.
- 2.
Youn, J. W. and Yang, Y. M., “A Study on Micro-Hole Drilling by EDM,” Transactions of the Korean Society of Mechanical Engineers, Vol. 14, No. 5, pp. 1155-1165, 1990.
- 3.
Kwon, H. M. and Jang, H. A, “Case Studies on Strengths and Weaknesses of Taguchi Method,” Journal of the Korean Institute of Industrial Engineers, Vol. 39, No. 5, pp. 383-392, 2013.
10.7232/JKIIE.2013.39.5.383
- 4.
Julong, D., “Introduction to Grey System Theory,” The Journal of Grey System, Vol. 1, No. 1, pp. 1-24, 1989.
- 5.
Jung, J. H. and Kwon, W. T., “Optimization of EDM Process for Multiple Performance Characteristics using Taguchi Method and Grey Relational Analysis,” Journal of Mechanical Science and Technology, Vol. 24, No. 5, pp. 1083-1090, 2010.
10.1007/s12206-010-0305-8
- 6.
Jahan, M., Wong, Y., and Rahman, M., “A Study on the Quality Micro-Hole Machining of Tungsten Carbide by Micro-EDM Process Using Transistor and RC-Type Pulse Generator,” Journal of Materials Processing Technology, Vol. 209, No. 4, pp. 1706-1716, 2009.
10.1016/j.jmatprotec.2008.04.029
- 7.
Lee, K., Lee, H. C., Lee, D. S., and Jung, H., “Drawing Lithography: Three Dimensional Fabrication of an Ultrahigh Aspect Ratio Microneedle,” Advanced Materials, Vol. 22, No. 4, pp. 483-486, 2010.
10.1002/adma.200902418
- 8.
Phadke, M. S., “Quality Engineering Using Robust Design,” Prentice Hall, pp. 60-62, 1989.