ABSTRACT
In modern society, industries are being upgraded in various fields. In particular, the defense industry has developed numerous technologies, such as the localization of core military technologies. The defense industry is actively studying technologies in areas such as in helicopters and tanks. In the case of radars, research on the radar itself is very active as is the research on the components that make up the radar. In this study, the temperature distribution of the two types of evacuation centers that make up the radar were analyzed using Computer Fluid Dynamics (CFD) to identify the temperature distribution based on the internal structure of the shelter. The two types of shelters have different heating values in different arrangements in the shelter provided they have the same size of heat source. Simulation results showed that the average temperature at the KA LNA shelter was different. In this study, we analyzed the effects of internal structure on the temperature and confirmed that the internal temperature may be decreased by changing the structure without using an external cooling element.
-
KEYWORDS: Computational fluid dynamics, Heat analysis, Radar, Shelter
-
KEYWORDS: 전산유체역학, 열해석, 레이더, 쉘터
NOMENCLATURE
Component of rate of deformation
Distance from point P to wall
1. Introduction
In modern societies, the industry is being upgraded in various fields. With the Fourth Industrial Revolution,
1 safety diagnosis based on artificial intelligence is being carried out and various coating methods are being studied for production technology and development of flexible applications for flexible display in the field of machine tools.
2-5 In particular, the defense industry has developed many technologies, such as domestication of core military technology, and the defense industry is actively researching fields such as helicopter and tram. In the case of detection equipment such as radar, precise detection capability of guided weapons used in the early battlefield is required. Numerous researches have been conducted to improve the accuracy of radar, and studies on parts constituting radar other than radar itself have been actively carried out. R. Kim designed three types of low-power cross-coupled voltage controlled generators for short range radar based on the CMOS process,
6 G. Choi designed of 77 GHz radar transmitter using 13 GHz CMOS frequency synthesizer and multiplier,
7 S. Jung designed and manufactured of CMOS SOC-based transceiver for an automotive radar on 77 GHZ
8 and J. Lee designed and fabricated power amplifiers for an active array phase radar system with an S bandwidth of 400 MHz.
9 G. Moon has also been attempting to improve radar performance using various techniques, such as applying a nonlinear Kalman filter to improve radar performance.
10 In the case of radar, various environmental factors such as wind, weather, and temperature due to external installation should be considered. Regarding temperature, finite element analysis has actively been applied in related research for a long time. It is difficult to attach sensors for temperature measurement because of the high temperature or process conditions. H.W. Park performed temperature prediction through the finite element analysis of temperature distribution in the electron beam polishing process,
11 and J.T. Kim estimated temperature distribution inside a solar cell module using a finite element analysis program
12 and made predictions through finite element analysis in various fields.
In this study, the temperature distribution of two types of shelters constituting radar is analyzed through CFD (Computational Fluid Dynamics) and the temperature distribution according to the inner structure of the shelter is confirmed. The Two types of shelter were designed to be applied to current radar.
2. CFD Simulation
2.1 Simulation Boundary Conditions
Temperature distribution models for five shelters were designed with a scale of 1:1 using ANSYS 13.0 Fluent to analyze the effects of the position and convection type of heat sources.
Fig. 1 shows the designs of the five shelters and their computational domains: (a) KA LNA shelter, (b) KA LNA shelter with air conditioner in hub (c) X LNA shelter (d) X LNA shelter with air conditioner in hub.
Table 1 shows features of the simulated designs. This information was based on information provided by ANSYS workbench and FLUENT.
Fig. 1Design of the two types shelters and computational domains thereof: (a, c) KA LNA shelter, (b, d) X LNA shelter
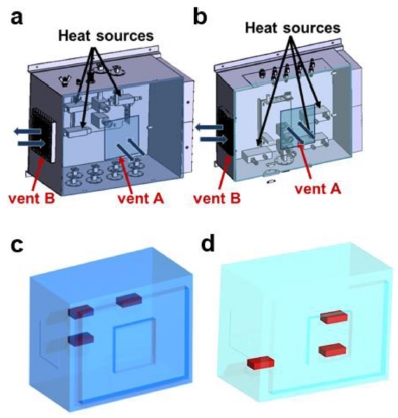
Table 1Heat source & air material properties
Table 1
|
Properties |
Unit |
Fluid |
Shelter
material |
|
Air |
Al |
|
Density |
Kg/m3
|
0.83 |
2,700 |
|
Specific heat |
J/(g*oC) |
1.013 |
0.9 |
Thermal conductivity
coefficient |
W/(m*oC) |
0.034 |
- |
Thermal expansion
coefficient |
m/(m*oC) |
2.43*10-6
|
- |
|
Viscosity |
N*s/m2
|
2.38*10-5
|
- |
|
Heat transfer coefficient |
W/(m*oC) |
- |
-228 |
In KA LNA (a-b) and X LNA shelters (c-d), three heat sources were installed at the center of the shelters. Air heated by the heat sources circulates through natural convection, and heat exchange occurs through the two vents shown in
Figs. 1(a) -
(d), and surfaces of the cover of each shelter. Air velocity was set to 0.10 m/s considering the range of natural convection (< 0.30 m/s).
Figs. 1(b) and
(d) show the structure of the KA LNA shelter and the X LNA shelter including the external hub and air conditioner, respectively.
13
where Th, Ta are the temperature of each heat source and ambient temperature, respectively; ΔT is variation of temperature; H is heat flux of the heat source; M and S are the mass and specific heat of the heat source, respectively.
The heated air enters the air path and is cooled in the air conditioner. The cooled air is emitted into the shelter and decreases the temperature of air in the shelter. Heat exchange occurs between the air emitted from the air conditioner and circulated in the shelter, and through the vent and surfaces of the cover of the shelter.
Table 2 shows the boundary conditions according to the designed shelters. Air velocities at the inlet and outlet of the air conditioner were set considering the air volumes and cross sectional areas at the inlet (800 m
3/h) and outlet (370 m
3/h). The temperature of cooled air was set considering the set temperature of the air conditioner. The temperatures of heat sources were derived using
Eq. 1. The temperatures derived according to the shelter types are listed in
Table 4.
Table 2Boundary condition for heat analysis
Table 2
|
Properties |
Value[Units] |
|
Shelter inlet velocity |
0.1 [m/s] |
|
External temperature |
30 [oC] |
|
Heat source temperature |
30 [oC] |
Table 3Simulation results of KA LNA shelter
Table 3
|
Properties |
Value |
|
Temperature range [oC] |
30 - 33.5 |
|
Minimum temperature position |
Area adjacent to vent A |
|
Average temperature [oC] |
32 |
|
Maximum temperature position |
Area adjacent heat source |
|
Air velocity rage [m/s] |
0.01 - 0.21 |
|
Minimum air velocity position |
Area adjacent shelter wall |
|
Average air velocity [m/s] |
0.11 |
|
Maximum air velocity position |
Area adjacent to vent B |
Table 4Simulation results of X LNA shelter
Table 4
|
Properties |
Value |
|
Temperature range [oC] |
30 - 34.6 |
|
Minimum temperature position |
Area adjacent to vent A |
|
Average temperature [oC] |
33 |
|
Maximum temperature position |
Area adjacent heat source |
|
Air velocity rage [m/s] |
0.01 - 0.23 |
|
Minimum air velocity position |
Area adjacent shelter wall |
|
Average air velocity [m/s] |
0.12 |
|
Maximum air velocity position |
Area adjacent to vent B |
The outlet velocities of the air conditioner inside the KA LNA shelter and the X LNA shelter hub were selected based on the velocity of the air conditioner (= 6 m/s) used in general. In the Ka RF shelter, air velocities at the inlet and outlet of the condenser were set to 8.54 m/s and 3.40 m/s, respectively, considering the air volumes and cross sectional areas at the inlet (800 m
3/h) and outlet (370 m
3/h). The temperature of the heat sources was calculated using
Eq. 1.
The flow fields in the computational domains of the five shelters were discretized by ANSYS 13.0. All wall elements were discretized with hex mesh elements to increase convergence and the accuracy of simulation results. The numbers of mesh elements in the KA LNA, X LNA, and RF shelters were 60482, 59763, and 207683, respectively.
The
k-
ε model and standard wall function were used to model the turbulence field, for which the governing equations are defined as
Eqs. (2) -
(4).
where ρ is density of air; k is turbulent kinetic energy; ui is velocity component in the corresponding direction; Eij is the component of rate of deformation; ε is dissipation; μt is eddy viscosity; σk, σε, C1ε, and C2ε are adjustable constants that can be derived by numerical iterations of data fitting for a wide range of turbulent flows; kp is turbulent kinetic energy at a point P; yP is the distance from point P to a wall.
3. Simulation Results
3.1 Computational Fluid Dynamics Analysis of Temperature Distribution in Shelters KA LNA Shelter
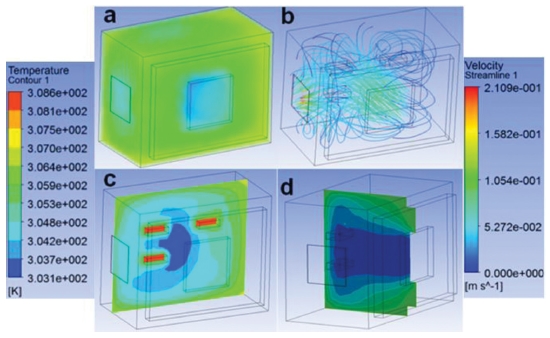
Fig. 2 shows (a) the temperature distribution and (b) air flow in the shelter, and (c-d) cross sectional contour plots in the heat sources. The temperature in the shelter ranged from 30
oC (adjacent to vent A) to 33.5
oC (adjacent to heat source), with an average of approximately 32
oC. The temperature decreased with proximity to the two air vents. Specifically, the temperature decrement of air in vent A is larger than in vent B although air velocity was higher in vent B than vent A. This could be attributed to the small difference of air velocity between vents A and B, and the larger cross sectional area of vent A than vent B; heat exchange between the ambient air and the air in the shelter takes place at the cross sectional area by convection. Moreover, vent A is located much father from the heat sources than vent B.
Fig. 2(a) Temperature distribution in the KA LNA shelter; (b) air flow in the KA LNA shelter; (c, d) cross sectional contour plot in the heat source

3.2 Computational Fluid Dynamics Analysis of Temperature Distribution in Shelters X LNA Shelter
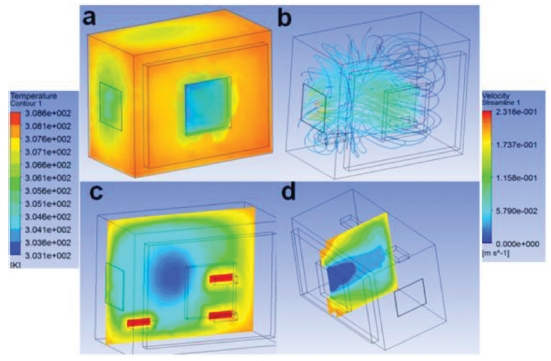
Fig. 3 shows the results of the temperature distribution simulation of the shelter. In the figure, a represents the temperature distribution inside the shelter and b represents the flow rate of the air circulating inside; c and d represent the temperature distribution of the internal cross-section.
Table 4 summarizes the simulation results. The temperature inside the shelter ranged from 30
oC to 34.6
oC, with an average of approximately 33
oC. The reason for the internal temperature of the X LNA shelter being higher than that of the KA LNA shelter is related to the placement of the heat source. In the case of the X LNA shelter, unlike the KA LNA shelter, the cooling efficiency due to natural convection drops because the number of heat sources in the vicinity of vent B is smaller.
Fig. 3(a) Temperature distribution in the KA LNA shelter; (b) air flow in the KA LNA shelter; (c, d) cross sectional contour plot in the heat source
4. Conclusion
In this study, the internal temperature distribution of two types of shelters containing radar was confirmed using heat sources. The shelter exhibited different temperature distributions according to the internal structure, and different internal temperatures according to the structure.
(1) In case of radar, because it is installed outdoors rather than indoors, it is highly affected by the environment. In particular, frequent faults occur due to increases in the temperature of components.
(2) The heat source of the KA LNA shelter and the X M LNA shelter constituting the radar was analyzed and the internal temperature distribution was confirmed.
(3) The mean temperature of the KA LNA shelter was 32oC, and the average temperature of the XM LNA shelter was 33oC. These differences were found to be due to differences in the arrangement of internal heat sources.
(4) Through this study, the effect of internal structure on the temperature was analyzed. Furthermore, it was verified that the temperature could be reduced through structural changes without external cooling factors.
REFERENCES
- 1.
Park, B. and Lee, C., “A Development on the Fault Prognosis of Bearing with Empirical Mode Decomposition and Artificial Neural Network,” Korean Society of Precision Engineering, Vol. 33, No. 12, pp. 985-992, 2016.
10.7736/KSPE.2016.33.12.985
- 2.
Park, J., Kim, D., and Lee, C., “Contact Angle Control of Sessile Drops on a Tensioned Web,” Applied Surface Science, Vol. 437, No. 4, pp. 329-335, 2018.
10.1016/j.apsusc.2017.12.152
- 3.
Park, J., Kim, S., and Lee, C., “An Analysis of Pinned Edge Layer of Slot-Die Coated Film in Roll-to-Roll Green Manufacturing System,” International Journal of Precision Engineering and Manufacturing-Green Technology, Vol. 5, No. 2, pp. 247-254, 2018.
10.1007/s40684-018-0025-6
- 4.
Lee, C., “Stresses and Defects in Roll Products: A Review of Stress Models and Control Techniques,” International Journal of Precision Engineering and Manufacturing, Vol. 19, No. 5, pp. 781-789, 2018.
10.1007/s12541-018-0094-z
- 5.
Lee, J. and Lee, C., “Improvement of a Splicing Machine To Decrease Abrupt Tension Changes and Tail Defects During the Roll Exchange Process in a Roll-to-Roll Manufacturing System,” International Journal of Precision Engineering and Manufacturing, Vol. 19, No. 8, pp. 1155-1161, 2018.
10.1007/s12541-018-0136-6
- 6.
Kim, R.-Y. and Kim, D.-W., “Design and Fabrication of CMOS Low-Power Cross-Coupled Voltage Controlled Oscillators for a Short Range Radar,” The Journal of Korean Institute of Electromagnetic Engineering and Science, Vol. 21, No. 6, pp. 591-600, 2010.
10.5515/KJKIEES.2010.21.6.591
- 7.
Song, U.-J., Kang, H.-S., Choi, K.-J., Cui, C., Kim, S.-K., et al., “Design of 77 GHZ Radar Transmitter Using 13 GHZ CMOS Frequency Synthesizer and Multiplier,” The Journal of Korean Institute of Electromagnetic Engineering and Science, Vol. 23, No. 11, pp. 1297-1306, 2012.
10.5515/KJKIEES.2012.23.11.1297
- 8.
Jeon, I.-S. and Chung, S.-T., “A Design and Manufacture of CMOS SoC-based Transceiver for an Automotive Radar on 77GHz,” Journal of Korean Institute of Information Technology, Vol. 13, No. 9, pp. 23-32, 2015.
10.14801/jkiit.2015.13.9.23
- 9.
Lee, J.-W., Lim, J.-H., Kang, M.-I., Han, J.-S., Kim, J.-P., et al., “Design and Fabrication of S-Band GaN SSPA for a Radar,” The Journal of Korean Institute of Electromagnetic Engineering and Science, Vol. 22, No. 12, pp. 1139-1147, 2011.
10.5515/KJKIEES.2011.22.12.1139
- 10.
Moon, G. H., Park, J. W., Jang, D. S., Tak, M. J., and No, J. E., “The Selection and Efficiency Improving of Nonlinear Kalman Filter for Radar Tracking Problem,” The Korean Society for Aeronautical and Space Sciences, No. 4, pp. 504-509, 2013.
- 11.
Kim, J., Kang, E., Lee, S., and Park, H., “Finite Element Analysis of Large-Electron-Beam Polishing-Induced Temperature Distribution,” Journal of the Korean Society of Manufacturing Technology Engineers, Vol. 22, No. 6, pp. 931-936, 2013.
10.7735/ksmte.2013.22.6.931
- 12.
Park, Y.-E., Jung, T.-H., Go, S.-H., Ju, Y.-C., Kim, J.-T., et al., “Prediction of Temperature Distribution in PV Module using Finite Element Method,” Journal of the Korean Solar Energy Society, Vol. 36, No. 2, pp. 65-72, 2016.
10.7836/kses.2016.36.2.065
- 13.
Barakos, G., Mitsoulis, E., and Assimacopoulos, D., “Natural Convection Flow in a Square Cavity Revisited: Laminar and Turbulent Models with Wall Functions,” International Journal for Numerical Methods in Fluids, Vol. 18, No. 7, pp. 695-719, 1994.
10.1002/fld.1650180705
Biography
- Seongyong Kim
received the B.Eng. and M.Eng. degrees from the Department of Mechanical Design Engineering, Changwon National University, Changwon, Korea, in 2014, 2016, respectively, where he is currently working toward the Ph.D degree with the Department of Mechanical Design Engineering.
He has studied the radial stress distribution of winding system, computational fluid dynamics of slot-die coating process and analysis of strain in lamination process. His research interest includes printed electronic, CFD and FEM analysis roll-to-roll process including slot-die coating.
- Changwoo Lee
received the B.Eng., M.Eng., and Ph.D. degrees from the Department of Mechanical Engineering, Konkuk University, Seoul, Korea, in 2001, 2003, and 2008, respectively. He is currently an Associate Professor with the Department of Mechanical Engineering, Changwon National University, Changwon, Korea. His research interests include the areas of prognostic system for smart factory, web handling systems, fault-tolerant control, roll-to-roll printing and coating system, and finite-element analysis of behavior of flexible films in large-scale systems. He is the holder of several patents related to continuous roll-to-roll systems.