ABSTRACT
From 2010, the first version of Microsoft Kinect, a low-cost RGB-D camera, was released which used structured light technology to capture depth information. This device has been widely applied in many segments of the industry. In July 2014, the second version of Microsoft Kinect was launched with improved hardware. Obtaining point clouds of an observed scene with high frequency being possible leads to imaging its application to meeting the demand of 3D data acquisition. However, evaluating device capacity for mechanical part modeling has been a challenge needed to be solved. This paper intends to enhance acquired depth maps of the Microsoft Kinect v2 device for mechanical part modeling and receive an assessment about the accuracy of 3D reconstruction. Influence of materials for mechanical part modeling is also evaluated. Additionally, experimental methodology for 3D modeling of the mechanical part is finally reported to ascertain the proposed model in this paper.
-
KEYWORDS: Mechanical part, 3D Modeling, Point-cloud, Microsoft Kinect v2, Depth map enhancement
NOMENCLATURE
Device-dependent color and depth model
1. Introduction
In the past few decades, the procedure of digitizing the shape of physical objects, often abbreviated as the 3D reconstruction, has been widely used everywhere from the entertainment to the industry.
1-4 The target is to capture the 3D data of each point on the surface of a physical object, 3D coordinates, depth and normal. By constructing all these points following the reconstruction framework, shown in
Fig. 1, the 3D model of the object can be reconstructed.
Fig. 1 The 3D reconstruction framework4 (Adapted from Ref. 4 on the basis of open access)
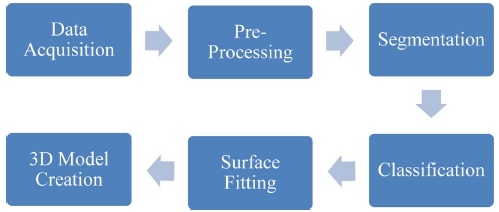
Relating to applications in mechanical engineering, the 3D reconstruction aims at extracting information from a collected raw data to reconstruct the closest version of an appropriate parametric CAD model to the initial design of the object. In the “Data Acquisition” step (
Fig. 1), satisfactory results are achievable with the commercial shelled devices, but their purchase price is too high for small businesses. Being launched in 2010, Microsoft Kinect v1, a low-cost RGB-D camera, used the structured light technology to acquire the depth data. The second version of Microsoft Kinect was released in 2014, which much improved the depth measurement accuracy. The latest Microsoft Kinect applies a ToF technology for acquiring the depth data. It also helps to achieve the depth info with better resolution than Microsoft Kinect v1 while also limiting the interference from outside sources.
5 This work intensively emphasizes on evaluating the capturing potentiality of Microsoft Kinect v2 for mechanical part modelling.
As far as the authors’ concern, the accuracy of Microsoft Kinect v2 and the influence of physical object materials for modeling of mechanical part have not yet been evaluated so far. Therefore, the authors make assessments on its accuracy and desire to spread below contributions:
· The acquired depth maps of the Microsoft Kinect v2 device for mechanical part modelling is enhanced and a cone strategy to improve the quality of the depth measurements accuracy is received.
· The influence of materials on mechanical part to evaluate changes in the captured depth values is utilized.
The rest of the paper is structured as follows. First, some researches related existing works about depth accuracy assessment are introduced in
Section 2. How to create an accurate 3D point cloud with the enhanced depth map is presented in detail in the
Section 3. The experimental tests and discussions are depicted in
Section 4. Finally, the conclusion and the potential improvement of this paper are discussed in the last section.
2. Related Works
Since appearance, Microsoft Kinect has been a subject for many approaches to have been developed with the hope to give thorough evaluation on its accuracy. A mathematical model for depth data acquired by the Kinect device is proposed.
1 In their work, a deep perception of the parameters affecting the accuracy of the depth data through a theoretical error analysis is introduced. In order to compute the 3D data, the internal and external parameters in the calibration process, such as focal length, principle point, lens distortion coefficients, base length, and the distance of the reference pattern are used in their model. The experimental results proved that the random error of measuring depth data is directly proportional to the increase in distance between the camera and the measuring object.
A comprehensive evaluation of the Microsoft Kinect v2 sensor for the purpose of 3D reconstruction is explained by Lachat et al..
6 In their tests, the influence factors of Microsoft Kinect v2 3D capturing and the error sources are analyzed. The results of repeated measurements have proved that the averaging procedure does not create a huge influence on the final accuracy of the measurements. Besides, the existing noise of the sensor is decreased compared to the first version of Microsoft Kinect device and it fundamentally appears at objects boundaries where artifacts are unavoidable. However, their research focused on every pixel, and did not concern removal holes or trips.
Being distorted by several phenomena, the realized measurements are regarded as the major problem when dealing with TOF cameras. In order to ensure the reliability of the obtained point clouds, especially for the purpose of accurate 3D modeling, the mentioned distortions are necessarily eliminated. To solve this problem, a thorough understanding of the multiple error sources which lead to influences on the measurements is of great importance. The sources of errors on measurements is described and summarized in detail by Lefloch et al..
7 A systematic deformation, also named as systematic wiggling error, which relates to depth information, is reported by Lindner et al..
8 This deformation partially results from in homogeneities on the process of modulating the optical beam. That study mainly contributes to propose a new calibration method for reflectivity related errors which aim at reducing the number of reference images in comparison with prior models.
For systems with more Microsoft Kinect v2, the new approach by Yang et al.
9 is developed to improve the depth measurement. Their works also focused on assessing the depth accuracy of Microsoft Kinect v2. In comparison with Microsoft Kinect v1, the performances on the hardware according to the issued specifications. Many important attributes of Microsoft Kinect v2 devices for actual usage, such as accurate distribution, depth resolution, depth entropy, edge interference and structural noise, are investigated. The results contribute to conducting experimental tests and presenting a good accuracy for Microsoft Kinect v2 after positioning the object within suitable areas.
Although there are lots of researches for the capacity of Microsoft Kinect v2 for 3D modelling, many problems and challenges have remained. This paper tries to face some of them such as different distributions of the capacity of the device for mechanical part modelling, in order to improve the existing methods, especially the influence of materials for modelling of the mechanical part.
3. Performance of Microsoft Kinect v2
It is highly appreciated to have a good understanding of these potential sources of errors to evaluate the accuracy of the 3D model. Most features of Microsoft Kinect v2 for depth measurements, such as the influence of frame averaging, preheating time, the influence of materials and colors, and outdoor efficiency,
6 or the influence of the simultaneously multiple Kinects
9 have been studied. For 3D mechanical part modelling,
4 3D model quality is based powerfully on the point cloud in the “data acquisition” step and the algorithms in other steps used to create the model. It is necessary to improve the accuracy of generating point clouds.
Microsoft Kinect v2 device is consisted of two cameras, particularly, an infrared camera and an RGB camera. The device also has three infrared light sources, each of which produces a modulated wave with a various amplitude. Specifications of the device are shown in
Table 1.
Table 1Specifications of Microsoft Kinect v2
Table 1
|
RGB camera resolution |
1920 × 1080 pixels |
|
Infrared camera resolution |
512 × 424 pixels |
|
Framerate |
Up to 30 Hz |
|
Field of view |
70 × 60 degrees |
|
Range of operation |
From 0.5 to 4.5 m |
In the Microsoft Kinect v2 device, to measure depth values, the optical ToF technology is used. It is based on measuring the time it takes for a light wave to travel from an infrared light source to object and back to infrared camera, illustrated in
Fig. 2. Let d be a distance from Kinect v2 to the physical object, based on light modulation, using indirect ToF system instead of the direct measurement of runtime, a phase variation Δ
φ between transmitted and obtained signal is measured. The estimated distance
d is calculated by the following
Eq. (1).
5
Fig. 2TOF operation principle
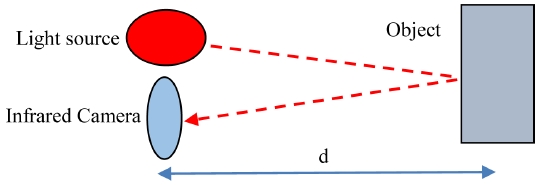
where f represents the modulation frequency, c is the speed of light in air.
Each Microsoft Kinect v2 camera has its own depth intrinsic parameters which are sensor and lens dependent. Each Kinect v2 is calibrated in the factory and the intrinsic parameters are stored in the internal memory of the Microsoft Kinect v2 device. These parameters can be acquired and stored with the help of the Kin2 toolbox developed for Matlab.
10 The depth intrinsic parameters of the infrared camera in the Microsoft Kinect v2 device using in this paper are introduced in the
Table 2.
Table 2The estimated depth intrinsic parameters
Table 2
|
Intrinsic parameters |
Values (Pixels) |
|
Focal length |
F
x
|
362.8785 |
|
F
y
|
362.8785 |
|
Principal point |
C
x
|
253.8325 |
|
C
y
|
204.4191 |
|
Radial distortion |
K1 (2nd) |
204.4191 |
|
K2 (4th) |
-0.2698 |
|
K3 (6th) |
0.0888 |
The depth maps of the object are then converted into 3D point clouds using the intrinsic parameters of the infrared camera, the acquired depth data and the perspective projection relationship. Each pixel
p(
u,
v) in these depth maps is converted into a physical location
P(
X,
Y,
Z) in 3D point cloud with respect to the location of the infrared camera in the Microsoft Kinect, i.e. the origin of the point cloud now generated is located at the position of the depth camera of the Microsoft Kinect v2. The
X and
Y coordinates of the point
P corresponding to each pixel
p in a depth map are calculated using the
Eqs. (2) and
(3)
where Z is the intensity value of the pixel p(u, v) in the depth map.
3.2 Depth Image Enhancement
Consider an assumption in which N numbers of depth frames are acquired, each frame being of resolution
U ×
V pixels. For each pixel location (
u,
v), there are N data samples, which also contains outliers due to the noise inherent to the camera. From these
N samples, the outliers need to be removed. The outliers in the data acquired are removed based on the median absolute deviation (MAD) of data.
11
The MAD of a normal distribution is the median of absolute deviation from the median, and defined by
where M is the median of a given distribution, X represents the set containing the N samples of data, xi is every individual sample in the data set X. Presuming the depth intensities to be a normal distribution, b = 1.4826 is chose,13 ignoring the abnormalities induced by the outliers in the data.
The criterion for detecting outliers is up to a threshold value set based on the value of MAD. The
Eq. (5) is shown as follow
In the situation, a given sample
xi of data set
X satisfies the
Eq. (5), this sample belongs to the data set. If more than 50% of the data has the same value, then the MAD becomes zero. In this case, the detection technique does not work.
After the outliers in the depth pixel intensities are detected and discarded for each set X, the remaining samples of depth intensities are averaged to acquire a value for pixel location (u, v) in the averaged depth map.
A pixel in a depth map is said to be invalid if it does not take any depth information, i.e. if the intensity value of that pixel is undefined or zero. The invalid pixels in a depth map are called holes in this work. These holes need to be filled with valid depth values in order to avoid any holes in the point clouds. The holes in the depth data are occupied using the eight nearest neighbor principle, which applies a set of intensities of the 8 nearest neighbors of a hole for calculating its depth value based on the mean of those 8 nearest neighbors. Holes in the averaged depth maps are filled and stored.
4. Results and Discussion
4.1 Experimental Setup
The hardware of this research study is a Microsoft Kinect for Windows v2.0 device, a PC with system CPU Intel (R) Core i7-4790 3,6GHz; RAM 12GB; Video card Geforce NVIDIA GV-N730D5-2GI. The software requirements for acquiring and processing data from a Microsoft Kinect device are Window 10 operating system, MATLAB 2016a with image processing toolbox, computer vision system toolbox, Kinect for Windows hardware support package for MATLAB, Kin2 toolbox for MATLAB
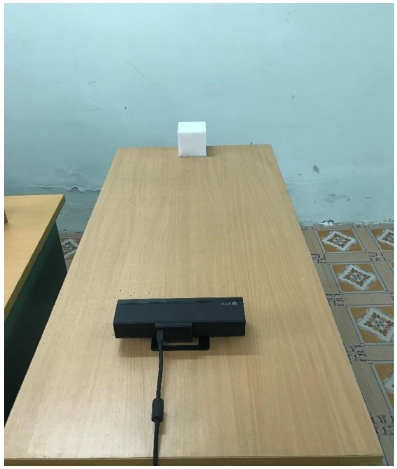
11, Microsoft Kinect SDK V2.0_1409 and Microsoft Visual Studio 2015. We consider an optimal distance of approximately 0.83 meters between the Kinect and the sample.
10 The experimental setup for data acquisition in this research is presented in
Fig. 3.
Fig. 3Experimental setup

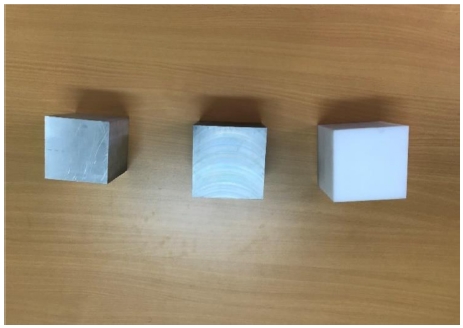
The objects under study are three cubes manufactured by the same machining operation, depicted in
Fig. 4. They are aluminum, steel, and plastic respectively from left to right.
Fig. 4The samples characterized by materials

4.2 Influence of Depth Image Enhancement
Initially, a set of depth maps of the surface of plastic cube are acquired. The acquired depth maps are then enhanced and holes in the data are filled based on the
Eqs. (4) and
(5). For hole filling purposes, the MATLAB function "imfill" is used, as it works based on the same principle. After the outliers and the holes in the depth maps of the environment are discarded, a single averaged and hole filled depth map for each position of the object is constructed.
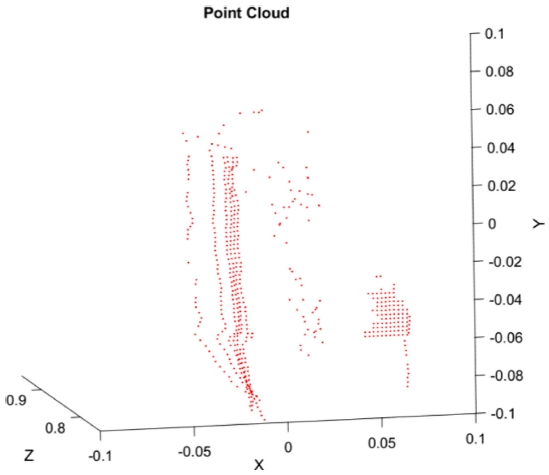
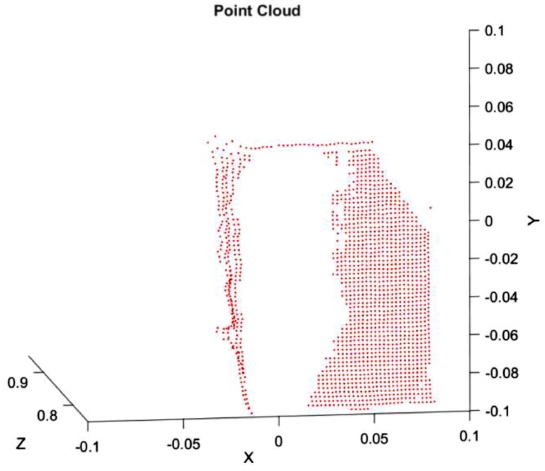
Figs. 5 and
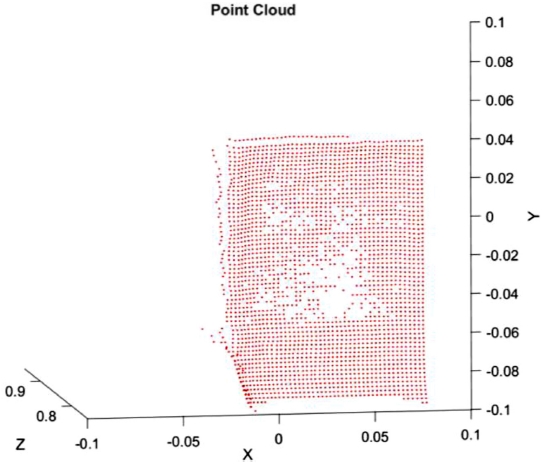
6 show the point cloud of the surface of the plastic cube without and with depth image enhancement.
Fig. 5The point cloud without depth image enhancement
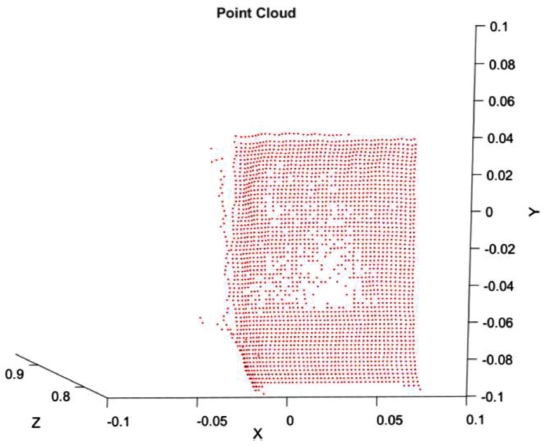
Fig. 6The point cloud with depth image enhancement
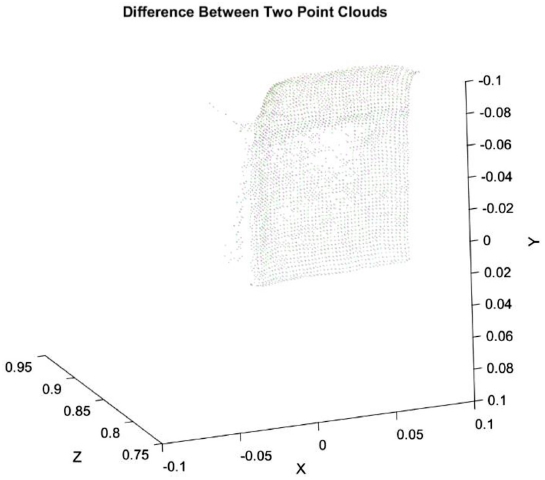
A visualization depicting the differences between the two point clouds is created and illustrated in
Fig. 7. The differences are displayed using a blending of magenta for point cloud with depth image enhancement and green for point cloud without depth image enhancement. When compared to the point cloud without depth image enhancement, it could be observed that the point cloud with depth image enhancement has considerably less holes. We can observe that the holes present on the surface of the cube are filled. In the point cloud without depth image enhancement,
X and
Y run from 250 mm to 750 m, range of
Z from 823 to 839 mm. The average value of
Z and its deviation respectively are 831.4 and 3.2 mm. With the same way, in the point cloud with depth image enhancement, the range of
Z runs from 828 to 835 mm. The average value of
Z and its deviation are 831.9 and 2.1 mm, respectively.
Fig. 7The differences between the two point clouds
4.3 Influence of Material of Mechanical Part
These samples featured by different reflectivity have been applied to evaluate the impacts of different materials on the intensity and on depth measurements. The sample’s surface was positioned parallel to the Microsoft Kinect v2. It seems that materials with high reflectivity turn out distinguishing among all the samples. Moreover, their depth images display lower intensity values than others. Consequently, the estimated depth values get greater than demanded in the depth maps. The most impact is recognized on the surface of aluminum, a highly reflective material. The acquisitions were performed with the same condition.
The resulting point cloud of the surface of the aluminum cube is presented in
Fig. 8. In this situation, most of the aluminum cube surface is missed. As a result of the experiment, there are around 3,500 visible points on this data in comparison with around 23,708 visible points of the point cloud of the plastic cube’s surface, which is about 15%. This experiment shows that this device is unable to work with the highly reflective surface like aluminum. Regarding
Fig. 9 which represents the point cloud of the surface of the steel cube, about 40% of “flying pixels” are compared with the point cloud of the surface of the plastic cube.
Fig. 8The point cloud of the aluminum cube

Fig. 9The point cloud of the steel cube

5. Conclusions
The aim of this paper was to evaluate some of the important attributes for manufacturing application of Microsoft Kinect v2, a low-cost device, for mechanical part modelling. Accuracy of the point cloud can be further improved by using image filters such as joint bilateral filters for filling the holes in a depth map. To implement that, experiments for the point cloud with depth image enhancement was obtained. However, it had to be noted that the computational complexity, hardware and time requirements of the process also increase significantly with the increase in the accuracy.
The impact of the object’s material was highlighted in some experiments. In particular, the surface of the object’s material is higher reflective, the quality of its point cloud is less than of others. Besides, the calibration processes of infrared camera are implemented. Thanks to the received results from experiments, some drawbacks of Microsoft Kinect v2 could be evaluated.
In the next study, the capacity of the Microsoft Kinect v2 for mechanical part modelling using coating layer as well as ICP algorithm to improve the accuracy of 3D reconstruction process will be continually evaluated not only in quality but also in quantity.
ACKNOWLEDGMENTS
This paper was presented at PRESM 2019
REFERENCES
- 1.
Khoshelham, K. and Elberink, S. O., “Accuracy and Resolution of Kinect Depth Data for Indoor Mapping Applications,” Sensors, Vol. 12, No. 2, pp. 1437-1454, 2012.
10.3390/s120201437
- 2.
Palomar, R., Cheikh, F. A., Edwin, B., Beghdadhi, A., and Elle, O. J., “Surface Reconstruction for Planning and Navigation of Liver Resections,” Computerized Medical Imaging and Graphics, Vol. 53, pp. 30-42, 2016.
10.1016/j.compmedimag.2016.07.003
- 3.
Kowsari, K. and Alassaf, M. H., “Weighted Unsupervised Learning for 3D Object Detection,” International Journal of Advanced Computer Science and Applications, Vol. 7 No. 1, pp. 584-593, 2016.
10.14569/IJACSA.2016.070180
- 4.
Buonamici, F., Carfagni, M., Furferi, R., Governi, L., Lapini, A., et al., “Reverse Engineering of Mechanical Parts: A Template-Based Approach,” Journal of Computational Design and Engineering, Vol. 5, No. 2, pp. 145-159, 2018.
10.1016/j.jcde.2017.11.009
- 5.
Sarbolandi, H., Lefloch, D., and Kolb, A., “Kinect Range Sensing: Structured-Light Versus Time-of-Flight Kinect,” Computer Vision and Image Understanding, Vol. 139, pp. 1-20, 2015.
10.1016/j.cviu.2015.05.006
- 6.
Lachat, E., Macher, H., Mittet, M., Landes, T., and Grussenmeyer, P., “First Experiences with Kinect v2 Sensor for Close Range 3D Modelling,” The International Archives of Photogrammetry, Remote Sensing and Spatial Information Sciences, Vol. 40, No. 5, pp. 93-100, 2015.
10.5194/isprsarchives-XL-5-W4-93-2015
- 7.
Lefloch, D., Nair, R., Lenzen, F., Schäfer, H., Streeter, L., et al., “Technical Foundation and Calibration Methods for Time-of-Flight Cameras,” in: Time-of-Flight and Depth Imaging. Sensors, Algorithms, and Applications, M., Theobalt C., Koch R., and Kolb A., (Eds.), Springer, pp. 3-24, 2013.
10.1007/978-3-642-44964-2_1
- 8.
Lindner, M., Schiller, I., Kolb, A., and Koch, R., “Time-of-Flight Sensor Calibration for Accurate Range Sensing,” Computer Vision and Image Understanding, Vol. 114, No. 12, pp. 1318-1328, 2010.
10.1016/j.cviu.2009.11.002
- 9.
Yang, L., Zhang, L., Dong, H., Alelaiwi, A., and El Saddik, A., “Evaluating and Improving the Depth Accuracy of Kinect for Windows v2,” IEEE Sensors Journal, Vol. 15, No. 8, pp. 4275-4285, 2015.
10.1109/JSEN.2015.2416651
- 10.
Terven, J. R. and Córdova-Esparza, D. M., “Kin2. a Kinect 2 Toolbox for MATLAB,” Science of Computer Programming, Vol. 130, pp. 97-106, 2016.
10.1016/j.scico.2016.05.009
- 11.
Leys, C., Ley, C., Klein, O., Bernard, P., and Licata, L., “Detecting Outliers: Do not Use Standard Deviation Around the Mean, Use Absolute Deviation Around the Median,” Journal of Experimental Social Psychology, Vol. 49, No. 4, pp. 764-766, 2013.
10.1016/j.jesp.2013.03.013
Biography
- Bui Van-Bien
Ph.D candidate in the School of Mechanical Engineering, Hanoi University of Science and Technology, Vietnam. His research interests are CAD/CAM, 3D Modelling and Machining process.
- Banh Tien-Long
Professor in the School of Mechanical Engineering, Hanoi University of Science and Technology, Vietnam. His research interests are Metal cutting, industrial instrument, CAD/CAM/CAE.
- Nguyen Duc-Toan
Associate Professor in the School of Mechanical Engineering, Hanoi University of Science and Technology, Vietnam. His research interests are Plasticity, Machining Process, CAD/CAM/CAE.