ABSTRACT
The fundamental flow models of metallic materials at room temperature, including the Ludwik, Hollomon, Swift and Voce models, were evaluated in terms of tensile test with an emphasis on the necking phenomena and post-necking behavior, to emphasize their limitation in satisfying tensile strength and Considère condition as well as the pre-necking and post-necking strain hardening. To resolve this limitation and enhance the applicability of the new proposed flow model to typical strain hardening materials, the Ludwik-Swift blended flow model is proposed after investigation into three blended flow models among the Ludwik, Voce and Swift models. Results revealed that there is no interpolation-based blended flow model of the fundamental flow models for the example flow curve exhibiting typical strain hardening but that the extrapolation-based combination of them can provide an engineering solution when the Ludwik and Swift models are blended. It was revealed that the reason for their good matching lies in the distinct difference in the strain hardening exponent, between the Ludwik and Swift models in the case of metallic materials with typical strain hardening.
-
KEYWORDS: Blended flow model, Ludwik-Swift model, Ludwik-Voce model, Swift-Voce model, Cylindrical tensile test, Post-Necking strain hardening
-
KEYWORDS: 혼합 유동모델, Ludwik-Swift 모델, Ludwik-Voce 모델, Swift-Voce 모델, 원통 인장시험, 포스트-네킹 변형경화
1. 서론
체적소성가공 시뮬레이션 기술은 소성가공 산업 혁신의 중심에 서 있다. 이론과 응용 기술의 꾸준한 발전으로 인해 예측 결과와 실험 결과의 차이는 점점 더 좁아지고 있다. 체적소성가공 시뮬레이션 기술에 영향을 미치는 주요 요소는 재료의 유동특성
[1]과 마찰특성
[2]이다. 재료의 상태와 공정의 조건에 영향을 받는 이러한 유동특성, 특히 냉간 소성가공용 재료의 유동특성은 재료의 사전 소성변형 및 열처리 등의 상태에 크게 의존적이기 때문에 관련 학문적 및 기술적 발전이 기대 수준에 미치지 못하고 있다. 상온에서 금속 재료의 유동특성은 전통적인 주제이지만, 최근, 자동차 경량화, 균열 또는 충돌 시뮬레이션을 위한 전체 재료 정보, DIC를 비롯한 측정 시스템 기술 개발 등의 시대적 요구로 인하여 관련 연구가 활발히 진행되고 있다
[3-
7].
체적소성가공 시뮬레이션에서 흔히 재료는 등방성 경화 특성을 따른다는 가정에 바탕을 두고 있다. 등방성 경화의 가정 범위 이내에서 상온에서의 유동특성과 관련된 주요 문제는 고변형률에서의 유동응력을 획득하는 데 따르는 어려움, 유동응력의 수식적 표현 방법, 인장시험의 해석 가능 여부 등으로 요약된다. 지속적으로 적용 영역이 확대되고 있는 자동다단 냉간단조에 의해 단조되는 재료는 대부분 3.0 이상의 변형률을 겪는다
[8-
10].
체적소성가공 공정 해석용 유동응력의 획득을 위하여 중실축대칭 소재를 이용한 시험이 널리 활용되고 있다. 원통 인장시험은 단순하면서도 고변형률까지 재현성과 신뢰성이 높아 체적소성가공용 유동특성과 파단 현상을 파악하는 데 유리하다. Mirone
[11]은 인장시험을 이용하여 Bridgman의 네킹부 곡률측정법
[12]을 개선시켜 변형률 1.1까지 유동응력을 계산하였으나 오차를 줄여 주는 기법이 접목되지 않았기 때문에 정확도 측면에서 단점을 지니고 있다. Joun 등
[13]은 실용적 실험-수치 혼합법(Experimental-Numerical Combined Method)으로 인장시험을 활용한 유동응력 획득 기법을 개발하였으며, SCM435의 경우 1.6의 변형률에서 유동응력을 획득하였다. Kamaya와 Kawakubo
[14]는 역계산법(Inverse Method)으로 노치중실실린더(Notched Solid Cylinder)를 활용하여 변형률 0.85에서 유동응력을 획득하였다. Hering 등
[15]은 전방 압출 이후의 인장시험을 통하여 1.7 내외의 변형률에서 유동응력을 획득하였다. 그러나 이 방식은 비용이 많이 소요되고, 마찰에 큰 영향을 받으며, 인장시험의 예측과는 무관한 단점이 있다.
원통 인장시험을 활용한 실험-수치 혼합법이 크게 발전하지 않은 원인은 인장시험의 결과가 네킹에 크게 의존적이며, 수치적으로 민감하게 영향을 받기 때문에 일반적인 오차 최소화 기법의 적용이 용이하지 않기 때문이다
[5]. 전술한 고변형률에서의 유동응력 획득 방법 중에서 Joun 등의 방법은 인장시험의 고정도 예측에 사용될 수가 있다. 이것은 인장시험에서 발생하는 파단 현상을 밝히는데 필요한 유동특성으로 직접 사용될 수 있는 이점이 있다
[16].
유동응력의 연구 주제에서 유동응력의 표현 방식도 또 하나의 중요한 문제가 되고 있다. 구간함수로 표현하면, 이 문제는 수치 해석적 측면에서 근본적으로 해결되지만, 닫힌 꼴 함수(Closed-Form Function)로 표현하는 것은 중요하다. 무엇보다 닫힌 꼴 함수는 재료의 특성을 파악하고 단순화하는데 유리하다. 그리고 구간함수로부터 유동응력을 구할 수 있는 최대 변형률이 제한적인 반면, 자동다단 냉간단조의 경우에는 고변형률로 인하여 외삽이 불가피하다. 이때, 유동응력의 닫힌 꼴 함수 표현은 이 문제를 해결하는 데 도움을 준다. 그런데 전형적인 상온 유동곡선은 저변형률에서 급격한 기울기의 변화를 발생시키며, 변형률의 증가에 따라 그 기울기의 변화가 크게 감소하는 특징이 있어, 제한된 재료상수(수 계산으로 계산할 수 있는 최대의 수는 3개임)로 이러한 유동곡선의 표현이 용이하지 않다. 그리고 인장시험을 공학적으로 정확하게 예측하고자 할 경우, 항복강도, 인장강도, Considère 조건(네킹점에서 최대 인장하중 또는 최대 공칭응력이 작용해야 한다)
[17]을 만족해야 한다. 따라서 이 문제는 해의 존재 여부를 판단할 수 없는 매우 어려운 문제에 속한다.
전통적으로 냉간 단조 재료의 전형적인 진응력-변형률 곡선, 즉 유동곡선은 Ludwik
[18], Voce
[19], Hollomon
[20], Swift
[21] 등의 기본 유동모델(Fundamental Flow Model)에 의해 표현되었다. 이러한 전통적인 수식 모델들은 다수의 합금강을 포함한 많은 재료에 적용할 수 없음에도 불구하고, 재료의 유동문제를 해결하기 위하여 여전히 중요시되고 있다. Ludwik 모델은 확장성이 좋으므로 변형률 속도 및 온도의 영향을 표현하기 위한 목적으로 폭넓게 활용되었다
[22]. Hollomon 모델과 Swift 모델은 Ludwik 모델과 동일한 수학적 배경을 가지고 있다. 상수항을 0으로 가정하고 변형을 탄성변형과 소성변형으로 나누면 Ludwik 모델을 각각 Hollomon 및 Swift 모델로 변환할 수 있다. 그러나 재료는 항복 발생 직후 유동특성의 급격한 변화를 겪기 때문에, 특히 작은 변형률에서 각 모델은 고유한 특성을 갖는다. Hollomon은 과도한 변형률 연화를 보이는 것으로 알려져 있으므로 Joun 등
[13]은 변형률의 함수로 유동상수, 즉 강도계수를 수식화하여 이 문제를 보상하였다. Voce 모델은 점근 응력(Asymptotic Stress) 및 관련 피크 곡률점으로 인해 다른 기존 재료모델과 크게 다르다. 따라서 네킹 이후에는 상당히 다른 패턴을 보여준다. 즉, 과도한 포스트-네킹(Post-Necking) 변형연화를 나타낸다. 이러한 문제를 해결하기 위해 많은 연구자들이 Voce 모델을 개선하려고 시도하였다
[23-
27].
전술한 기본 유동모델이 안고 있는 한계를 극복하기 위한 방법으로 네 개 또는 그 이상의 유동상수를 사용하는 응용 유동모델들
[24-
26]이 개발되었다. 문제는 이러한 응용 유동모델의 경우, Considère 조건을 만족시키는 것이 용이하지 않다는 것이다. 대부분의 연구자들이 이러한 점을 무시한 데는, Joun 등
[13]의 연구 이전에는 포스트-네킹(Post-Necking) 변형률에 대한 유동응력의 획득이 사실상 불가능했기 때문이다. 최근 들어 DIC 등에 의하여 포스트-네킹 변형경화(Post-Necking Strain Hardening)의 획득이 보편화되었지만
[6,
7], 여전히 네 개 이상의 유동상수로 표현된 닫힌 꼴 함수를 사용할 경우, 프리-네킹(Pre-Necking) 변형경화, 포스트-네킹 변형경화, 인장강도, Considère 조건을 동시에 만족시키는데 있어 계산상 어려움이 따른다. 이 조건을 만족시키기 위하여 최소한 네 개의 유동상수가 필요하며, 방정식이 그 변수들에 민감하게 영향을 받기 때문이다. 이러한 문제의 해소를 위한 공학적 접근 방법이 Razali 등
[28]에 의하여 제안되었다.
변수는 늘리되, 해법이 비교적 간단한 방법으로 이미 혼합 유동모델이 다수의 연구자들에 의해 제안되었다. Sung 등
[29]은 Hollomon 모델과 Voce 모델의 혼합 유동모델을 제안하였고, Banabic과 Sester
[30]는 Swift 모델과 Hockett/Sherby 모델
[31]을 제안하였으며, Lemoine 등
[32]은 Swift 모델과 Voce 모델의 혼합 유동모델을 제안하였다. 그러나 이들은 대부분 저변형률에 초점을 맞춘 판재성형 측면에서 혼합 유동모델을 제안하였으며, 혼합 유동모델의 장점을 충분히 활용하지 못하였다.
전술한 바와 같이, 단일 유동모델은 일반적으로 네킹 전후의 변형경화 거동을 동시에 만족시킬 수 없다. 다수의 단일 유동모델이 주요 형상 요건(크기와 기울기 등)을 모두 충족하면, 그 선형조합도 주요 형상 요건을 충족한다. 따라서 이 경우, 선형조합, 즉 혼합 유동모델은 큰 어려움 없이 네킹 조건(네킹이 발생하는 변형률과 인장강도)뿐만 아니라 네킹 전후의 변형경화를 대표하는 점, 즉 대표 변형률에서 유동특성을 모두 만족시키는 목적으로 사용될 수 있다. 이러한 특징을 고려하여 인장시험에서 네킹 조건을 만족시키면서 네킹 전후의 대표 변형률에서 유동특성을 만족시키는 방법으로 실용적 혼합 유동모델을 제시한다.
2. 예제의 정의 및 전통적인 기본 유동모델의 비판
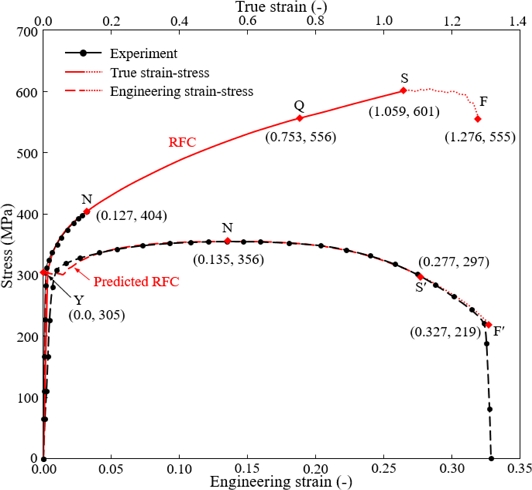
Fig. 1에서 하부의 파선은 원통 인장시험의 실험 결과를 나타낸다
[13]. 네킹점에서 공칭변형률과 진변형률은 각각 0.135, 0.127이고, 공칭응력과 진응력은 각각 356, 404 MPa이다.
Fig. 1 Reference flow curve obtained from a tensile test and its associated engineering stress-strain curves, experimental or predicted

Fig. 1에서 상부의 실선은 Joun 등
[13]의 방법으로 구한 SWCH10A의 유동곡선이며, 인장시험의 과정에서 재료가 겪는 진응력-변형률 곡선이다. 이 방법에서 프리-네킹 변형경화는 네킹 조건을 만족하는 Hollomon 유동곡선으로 표현하고, 포스트-네킹 변형경화는 변형률의 선형구간함수로 표현된 강도계수 함수를 축차적 방법으로 최적화하여 구한다.
Fig. 1에서 점 S 이후의 점선은 재료가 파단에 이르는 과정을 나타낸다. 이 연구에서 이 유동곡선은 기존 유동응력 모델을 평가하기 위한 기준 유동곡선(Reference Flow Curve, RFC)으로 사용된다. 이 유동곡선으로 해석한 인장시험(시편의 직경: 6.25 mm, 게이지 길이: 25 mm)의 결과를
Fig. 1의 하부에 파선으로 나타내었다.
Fig. 1에서 인장시험의 실험 결과와 해석 결과(유동특성 획득에 사용된 동일한 해석 조건으로 강소성 유한요소법
[33]을 사용하여 얻었음)를 비교한 결과, 네킹점에서부터 점 S에 상응하는 점 S’까지의 범위에서 실험 결과를 기준으로 했을 때 최대의 오차는 2.6%이다. 이것은 RFC가 인장시험 시에 발생하는 소성변형률과 그에 상응하는 유동응력을 잘 반영하고 있음을 입증한다.
이제 전통적인 유동모델인 Ludwik 모델, Voce 모델, Hollomon 모델, Swift 모델을 이용하여 RFC의 표현에 관해서 고찰해 본다. 이 전통 유동모델은 각각 다음과 같이 수식화되며, 괄호 속은 Considère 조건을 나타낸다.
(i) Ludwik model
(ii) Voce model
(iii) Hollomon model
(iv) Swift model
여기서 Y0L, L1, nL, Y0V, V1, V2, K, n, Y0S, S1, ns 등은 유동상수이며, εtN과 σtN은 각각 네킹점에서 진변형률과 진응력을 의미한다.
Hollomon의 유동상수는 2개이며, 나머지 유동모델은 3개의 유동상수로 표현된다. Hollomon 모델을 사용할 경우, 네킹점(인장강도와 Considère 조건)을 만족시킴으로써 2개의 유동상수를 결정할 수 있다. 그러므로 더 이상의 유동곡선에 대한 조건을 만족시킬 수가 없다. 유동곡선을 피팅할 때 Ludwik, Voce, Swift 모델은 네킹 조건을 만족시키면서 하나의 추가적인 점, 즉 대표 변형률에서 유동응력을 만족시킬 수 있다. 선행연구
[28]에 의하면, Swift 모델로
Fig. 1의 RFC상에서 네킹점과 점(0.016, 322 MPa)을 만족시키도록 한 결과, S의 지점에서 RFC 기준으로 약 13%의 오차를 보였으며, 이를 이용한 인장시험을 예측한 결과, 시험 결과 기준으로 인장하중의 오차가 23%에 다다랐다. 이것은 프리-네킹 변형경화 정보를 사용한 외삽의 비과학성을 웅변적으로 말해준다. 이 문제는 Swift 모델에만 해당되는 사항은 물론 아니다.
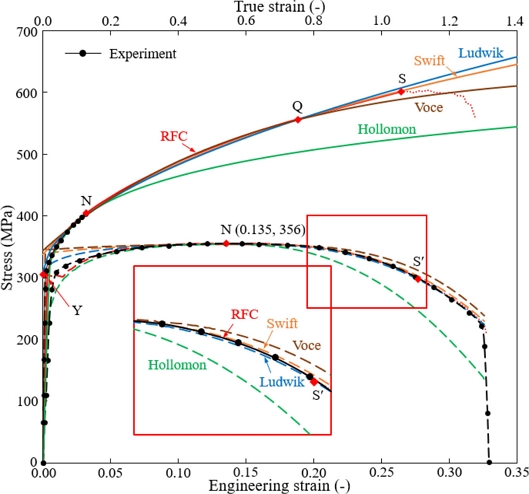
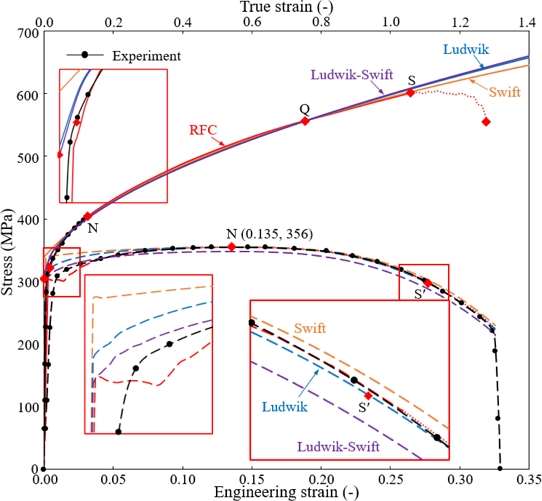
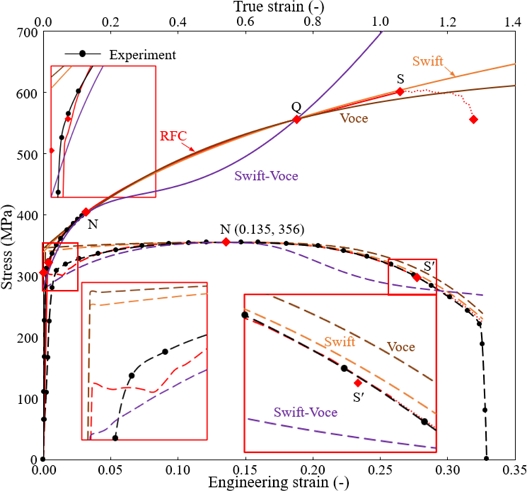
단조를 비롯한 체적소성가공의 경우, Considère 조건을 만족하는 Hollomon 모델의 변형경화지수보다 훨씬 큰 변형률에 대한 유동정보가 중요하다. 이 연구에서는 포스트-네킹 변형경화를 대표하는 점으로 점 Q (0.753, 556 MPa)를 결정하였다. 점 Q를 통과하도록 유동상수를 계산하여
Table 1에 나타내었으며, 유동곡선을
Fig. 2의 상부에 나타내어 RFC와 비교하였다.
Fig. 2의 하부에서는 인장시험의 실험과 5개의 유동곡선을 사용하여 예측한 인장시험 곡선을 비교하고 있다.
Table 1 Flow constants satisfying the necking conditions and the point Q on RFC
Table 1
|
Model name |
Flow constants |
|
Ludwik |
Y0L = 310 MPa, L1 = 289 MPa, nL = 0.557 |
|
Voce |
Y0V = 344 MPa, V1 = 294 MPa, V2 = 1.69 |
|
Hollomon |
K = 525 MPa, n = 0.127 |
|
Swift |
Y0S = 338 MPa, S1 = 6.72, ns = 0.276 |
Fig. 2 (Upper panel) RFC and four fundamental flow models with an emphasis on the necking point Q and (Lower panel) their corresponding tensile test predictions with the experimental tensile test

식(3)과
식(4)에서 보는 바와 같이, Hollomon 모델에서 변형경화지수는 네킹점에서의 진변형률이고, Swift 모델에서는 이 변형경화지수를 평형이동시킨 것이다. 그러나
식(1)에서 보는 바와 같이, Ludwik 모델에서 변형경화지수는 네킹점에서의 진변형률에다 1 -
Y0/
σtN을 나눈 값이다. 따라서 곡선의 형태에 큰 영향을 미치는 두 유동모델의 변형경화지수가 변형경화 재료의 경우 큰 차이를 보일 수밖에 없다.
Table 1에서 주목할 점은
nL값과
ns의 값의 큰 차이이다. 흔히 Ludwik 모델과 Swift 모델의 동질성을 감안하여 이 두 값의 차이가 작을 것으로 판단되지만, 점 Q로 대표되는 관심 영역에서는 비교적 큰 차이를 나타냄을 알 수 있다. 이 차이는
Fig. 2의 고변형률에서 두 모델의 차이를 발생시킨다. 이것은 두 모델이 혼합 유동모델의 기본 모델로 사용될 수 있는 가능성을 보여준다. 지금까지 연구자들이 이 두 모델의 조합에 관심을 가지지 않았던 것은 전술한 바와 같이 저변형률에서 두 모델의 수치상 유사성에 있는 것으로 판단된다.
Fig. 2의 인장시험의 예측 결과로부터 모든 기본 유동모델의 유동곡선들이 네킹 조건을 공학적 관점에서 정확하게 예측하였다. 그러나 Hollomon 모델은 유동곡선과 인장시험 곡선 모두 실험 결과에 비하여 큰 오차를 보인다. Voce 모델은 그 특성상 고변형률에서 변형경화를 과소 계산함을 보여주고 있고, 이로 인하여 인장시험에서도 큰 공칭변형률에서 다소의 오차를 발생시키고 있다. 따라서 Sung 등
[29]과 Lemoine 등
[32]의 혼합 유동모델에서 사용된 Voce 모델은 고변형률을 주안점으로 하는 체적소성가공 목적의 혼합 유동모델에는 적합하지 않을 수 있다. 그러나
Fig. 2로부터 저변형률에서는 Hollomon 모델을 제외한 세 개의 유동곡선이 실험과 다소 큰 차이를 나타낸다는 점을 알 수가 있다.
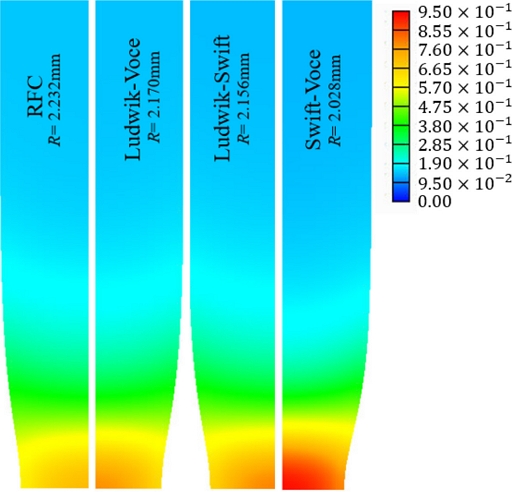
한편,
Fig. 3은 재료의 연화가 일어나는 지점인 점 S까지 인장시험을 유한요소법
[33]으로 예측한 시편의 형상을 비교한다.
Table 2는 RFC와 네 가지의 기본 유동모델을 적용하여 예측한 인장시험 시편에서의 최고 변형률과 네킹부의 반지름을 정량적으로 비교한다.
Fig. 3과
Table 2의 비교로부터 Hollomon 모델은 이 재료의 포스트-네킹 변형경화를 표현하는데 한계를 보이고 있다. 반면, 목표 유동곡선으로 설정한 RFC에 가장 근접하게 예측한 유동모델은 Swift 모델이다.
Fig. 3 Deformed shapes with effective strains of the tensile test at the point S’, predicted using the fitted fundamental flow models and RFC. R means the neck radius
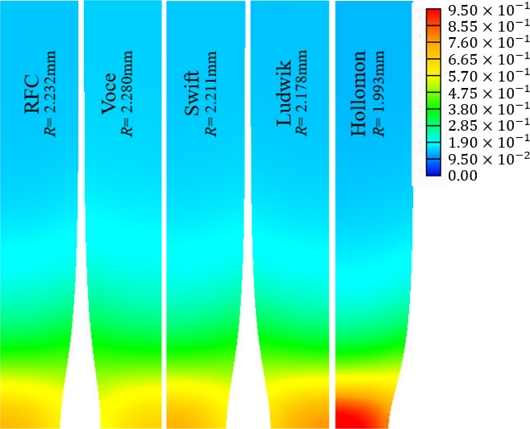
Table 2 Comparison of the predicted tensile tests (Fig. 2) at the strain corresponding to the point S
Table 2
|
Model |
Max.
Strain |
Radius at the
neck (R) [mm] |
Radius error at S
to RFC [%] |
Flow stress error at S to
RFC [%] |
Tensile load error
at S’ to experiment [%] |
|
RFC |
0.729 |
2.232 |
- |
- |
0.1 |
|
Ludwik |
0.786 |
2.178 |
-2.4 |
1.1 |
-0.5 |
|
Voce |
0.680 |
2.280 |
2.2 |
-1.9 |
4.4 |
|
Hollomon |
0.998 |
1.993 |
-10.7 |
-12.7 |
-17.6 |
|
Swift |
0.747 |
2.211 |
-0.9 |
0.3 |
1.3 |
전술한 내용과 고찰로부터, 전형적인 변형경화 재료의 네킹 조건을 만족시키면서 프리-네킹 변형경화와 포스트-네킹 변형경화를 동시에 만족시키는 기본 유동모델은 존재하지 않는다는 점을 짐작할 수 있다. 이 문제는, 네 개 또는 그 이상의 유동상수를 가진 응용 유동모델
[34]을 사용하면, 이론적으로는 해결 가능할 수도 있다. 실제 어느 정도의 오차를 허용한다면, 실용성을 확보할 수도 있다
[28]. 그러나 항복점과 네킹점 사이에서 급격하는 변화하는 유동특성을 감안할 때, 이 문제를 보다 근본적으로 해결할 실용적 모델은 아직까지 연구되지 않았다. Joun 등
[13]이 제안한 모델은 구간선형함수를 사용하여 많은 유동상수를 도입함으로써 대부분의 영역에서 신뢰할만한 유동곡선을 표현하는 장점이 있다. 그러나 그 한계는 획득된 유동응력의 적용범위, 즉 한계 변형률에 있다. Joun 등의 방법의 적용연구에 따르면, SCM435의 경우 1.6의 최대 변형률까지 유동응력의 획득이 가능하지만
[1,
34], 이 변형률은 자동다단 냉간단조
[9]에서 발생하는 최대 변형률에 크게 못 미치는 것이다.
고변형률에서 유동응력이 필요할 경우에는 필연적으로 외삽에 의하여 고변형률에서 유동응력을 추정해야 하거나 목표로 하는 점을 통과하는 유동곡선을 수식으로 표현해야 한다. 이러한 목적으로 프리-네킹 변형경화, 내킹 조건, 포스트-네킹 변형경화를 동시에 만족시키는 유동함수가 요구된다. 이러한 유동함수는 탄소성 유한요소법의 사용 시 탄성과 소성의 경계 영역에서 해의 정확도를 높이면서 고변형률에서도 해의 정확도를 높일 뿐만 아니라 인발 공정이나 네킹이 발생하는 충돌 현상의 해석과 소재의 파단 특성을 규명하기 위한 해석
[35] 등의 목적으로 사용될 수가 있다.
3. 혼합 유동모델
Hollomon 모델은 네킹 전후의 유동응력을 동시에 고정확도로 표현하는 목적으로 사용될 수가 없다. 따라서 나머지 세 개의 기본 유동모델 중에서 두 개를 기초 유동모델(Basis Flow Model)로 사용하여 혼합 유동모델을 구성하였다.
Fig. 2에서 보는 바와 같이 점 Q를 만족시키는 Ludwik, Voce, Swift 모델의 유동응력은 프리-네킹 변형률 영역에서 RFC보다 크다. 그 결과 예측된 공칭응력-변형률 곡선도 실험 곡선의 상부에 위치하고 있다. 이 사실은 Ludwick, Voce, Swift 모델을 기초 유동모델로 활용한 혼합 유동모델을 내분점의 개념을 활용하여 구할 수 없다는 것을 의미한다. 이것은 실제의 유동곡선이 항복점을 지나면서 급격한 기울기 변화를 겪는 반면, 점 Q를 만족시키는 기본 유동모델이 항복점을 표현하는데 한계를 보이기 때문에 발생한 것이다.
이 연구에서 논의의 대상으로 하는 혼합 유동모델을 위한 기초 유동모델의 조합은 혼합변수(Blending Parameter) α에 의하여 다음과 같이 표현된다.
여기서
식(5)부터
식(7)을 각각 Ludwik-Swift, Ludwik-Voce, Swift-Voce 혼합 유동모델이라고 한다. 변형률이 0일 때, 유동응력, 즉 항복강도가 305 MPa라고 가정하고(실제의 항복강도는 이 수치보다 작다), 이를 만족시키는 혼합변수를 구하면,
αls = 1.160 ,
αlv = 1.132,
αsv = 6.590이다. 따라서 모든 혼합변수가 0과 1 사이에 존재하지 않으므로 내분점은 존재하지 않는다. 이것이 답이 없다는 것을 의미하는 것이 아니다. 그러나 그 답의 오차가 증폭될 수 있다. 임의의 변형률에서 두 모델의 평균값을 기준으로 할 때 혼합 유동모델의 오차는 두 유동모델의 차이의 |
α - 0.5|배가 된다. 따라서 Ludwik 모델과 Swift 모델의 경우 평균값을 기준으로 했을 때 약 0.660배의 오차가 발생하며, 이것은 실질적으로는 두 모델의 오차의 16%가 Ludwik 모델로부터 바깥으로 벗어난 것이 된다. 따라서 두 모델의 차이가 작을 경우 두 모델을 이용한 혼합 유동모델의 오차는 크지 않다.
실제
Fig. 4로부터 0.0과 1.3 사이의 변형률에서 Ludwik 모델과 Swift 모델의 평균값 대비 오차의 최대값이 약 1.03% (= 6.55 / 638.65 MPa × 100)이므로 Ludwik 모델을 기준으로 유동응력의 최대 오차는 0.16% (= 1.03 × 0.16%)가 된다. 이 오차를
Fig. 4에서 확인할 수 있다. 즉, Ludwik-Swift 혼합 유동모델은 세 개의 점(항복점, 네킹점, Q점)을 통과하면서 그 이외의 점에서는 Ludwik 모델을 따라감을 알 수가 있다. 그리고 혼합 유동모델을 이용하여 예측한 공칭응력-공칭변형률 곡선은 인장시험으로 획득한 실험곡선과 유사하다. 따라서 이 검토 결과는 외삽에 근거한 Ludwik-Swift 혼합 유동모델을 이용하여,
Fig. 1의 RFC를 닫힌 꼴 함수로 표현하는 것이 공학적 차원에서 가능함을 의미한다.
Fig. 4 Comparison of flow curves models (Assumed yield strength = 305 MPa) and their corresponding tensile test predictions of the Ludwik, Swift, Ludwik-Swift models with an emphasis on the point Q
어떤 하나의 점(여기서는 항복점) 때문에 외삽을 해야 할 경우 두 모델 간의 차이가 그 점에서 클수록 외삽에 기인하는 오차가 작아진다. 전술한 논리는 Ludwik-Voce 혼합 유동모델에도 적용된다.
Fig. 5에서 보는 바와 같이 이 혼합 유동모델도 RFC에 근접함을 알 수 있다. 즉,
Table 1에서 Ludwik, Voce, Swift 모델의 항복강도(변형률 0에서 유동응력)는 각각 310, 344, 338 MPa이다. Ludwik과 Voce 모델의 항복강도 차가 Ludwik과 Swift 모델의 항복강도 차보다 크게 나타나고, 이것이
Table 3에서 보는 바와 같이 점 S에서의 두 혼합 유동모델의 정확도에 반영된 결과로 나타났다.
Fig. 5 Comparison of flow curves models (Assumed yield strength = 305 MPa) and their corresponding tensile test predictions of the Ludwik, Voce, Ludwik-Voce models with an emphasis on the point Q

Table 3 Comparison of contracted specimen radius and effective strain after tensile test simulations in which RFC and 3 different blended flow stress model were applied
Table 3
|
Model |
Max.
Strain |
Radius at the neck
[mm] |
Difference with respect to
RFC [%] |
Flow stress error at S
to RFC [%] |
Tensile load error at S’ to
experiment [%] |
|
RFC |
0.729 |
2.232 |
- |
- |
0.1 |
|
Ludwik-Swift |
0.805 |
2.156 |
3.4 |
1.2 |
-3.5 |
|
Ludwik-Voce |
0.790 |
2.170 |
2.8 |
1.5 |
-0.9 |
|
Swift-Voce |
0.936 |
2.028 |
9.1 |
12.7 |
-6.2 |
반면, Swift-Voce 혼합 유동모델의 경우, 피팅된 유동곡선에서 항복강도의 차이가 상대적으로 작다. 이 점은 Ludwik-Swift 및 Ludwik-Voce 혼합 유동모델과는 다르다. 그 결과, 혼합변수의 값이 6.59로 두 모델의 평균을 기준으로 하는 오차는 크게 됨을 알 수 있다. 이 결과는
Fig. 6에서 보는 바와 같이 요구된 조건인 네킹점 N과 대표 변형률 점 Q의 요구조건을 만족시키지만 그 점을 제외한 나머지의 변형률에서 상대적으로 큰 유동응력의 차이를 발생시켰다.
Fig. 6 Comparison of flow curves models (Assumed yield strength = 305 MPa) and their corresponding tensile test predictions of the Swift, Voce, Swift-Voce models with an emphasis on the point Q
전술한 세 가지의 혼합 유동모델의 인장시험 예측 정확도를 비교하기 위하여 인장시편의 형상 측정결과를
Fig. 7과
Table 3에 정리하였다. 이 인장시험 결과는 각 혼합 유동모델을 적용한 인장시험 시뮬레이션 결과를 바탕으로 한 것이며, 인장시험은 연화가 일어나기 직전의 유동응력 곡선의 S점까지 진행되었다.
Fig. 7과
Table 3에서 확인할 수 있는 바와 같이 두 모델의 항복강도 차가 큰 Ludwik-Voce 모델이 RFC 모델에 가장 근접한 예측 결과를 보이고 있다. 이것은 전술한 외삽 원리의 분석 결과와도 일치한다.
Fig. 7 Deformed shapes with effective strains of the tensile test at the point S’, predicted using the blended flow models (Assumed yield strength = 305 MPa) and RFC. R means the neck radius
한편, 앞에서 설명한 Ludwik 모델을 기반으로 하는 두 개의 혼합 유동모델, 즉 Ludwik-Swift 및 Ludwik-Voce 혼합 유동모델의 진응력-변형률 곡선과 이를 이용하여 예측된 공칭응력-변형률 곡선은 상당한 변형률 범위에서 각각 RFC와 실험 공칭응력-변형률 곡선을 미소한 오차로 따라가는 결과를 보인다. 네킹점의 반지름도 3.4% 이내로 RFC 모델과 작은 차이를 보인다. 그러나
Figs. 4와
5의 확대된 저변형률 구간에서 보는 바와 같이, 혼합 유동모델의 유동곡선이 Ludwik 모델의 유동곡선과 유사하게 결정되며, 예측된 공칭응력-변형률 선도의 경우도 Ludwik 모델을 적용한 인장시험의 예측결과와 유사하게 나타난다. 이러한 이유로 혼합 유동모델의 유동응력 곡선은 저 변형률 구간에서 RFC 모델과 큰 차이를 보이며, 이에 상응하는 인장시험 예측 결과의 오차도 비교적 크다. 이것은 Ludwik 모델의 항복강도 310이 혼합 유동모델의 항복강도로 추정한 305 MPa과 매우 가깝고 혼합 유동모델의 다른 모델과는 멀리 떨어져 있기 때문이라고 추정된다. 그 근본 원인은 인위적으로 305 MPa를 추정한 데 있다. 실제 추정된 305 MPa의 항복강도는 실제 값보다 다소 크다는 사실을
Figs. 4부터
6의 저변형률 구간에서 확대된 그림들은 강조하고 있다.
전술한 바와 같이 혼합 유동모델이 Ludwik의 모델과 유사하게 형성되는 점을 보완하기 위해 항복강도를 Y0 = 305보다 작은 Y0 = 280MPa로 추정하여 혼합 유동모델을 도출해 보았다. 이 새로운 항복강도를 만족시키는 혼합변수는 αls = 2.032, αlv = 1.855, αsv = 10.792 로 계산된다.
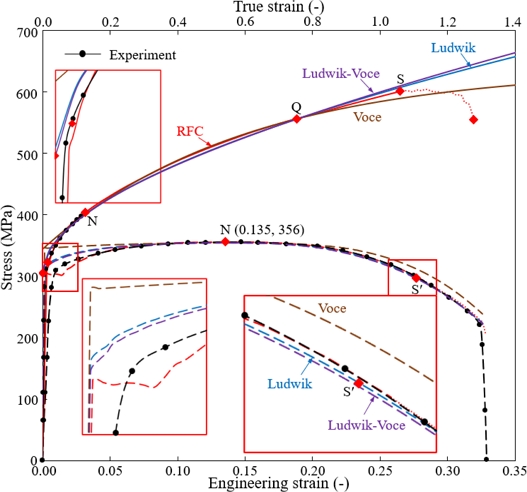
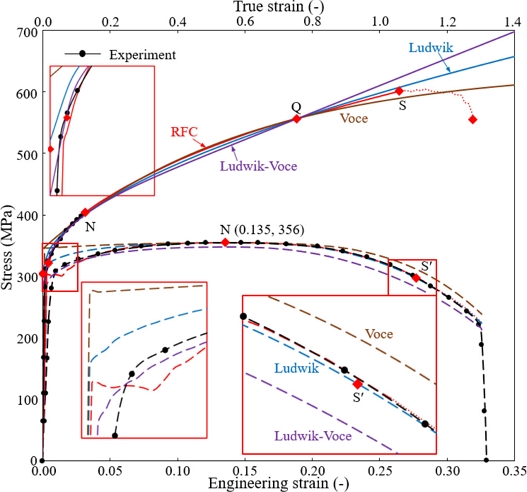
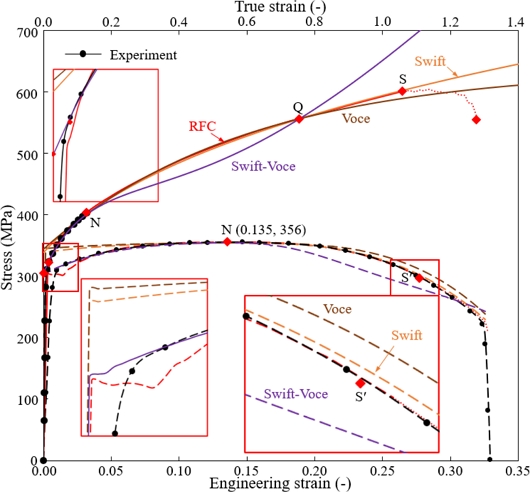
항복강도(280 MPa), 네킹점(0.127, 404 MPa), 진응력-변형률 곡선상의 한 점 Q(0.753, 556 MPa)를 지나는 혼합 유동모델, 즉 Ludwik-Swift, Ludwik-Voce, Swift-Voce 모델을 적용한 인장시험의 시뮬레이션 결과를
Figs. 8부터
10에 각각 나타내었다. 항복점이 낮아짐으로 인하여 유동곡선과 인장시험 결과 선도 모두 저변형률 구간에서 RFC 모델의 유동선도와 인장시험 결과에 보다 가깝게 접근하므로 이 구간에서 유동모델의 정확도 향상이 이루어졌다.
Fig. 8 Comparison of flow stresses models (Assumed yield strength = 280 MPa) and their corresponding tensile test predictions of the Ludwik, Swift and Ludwik-Swift models with an emphasis on the point Q
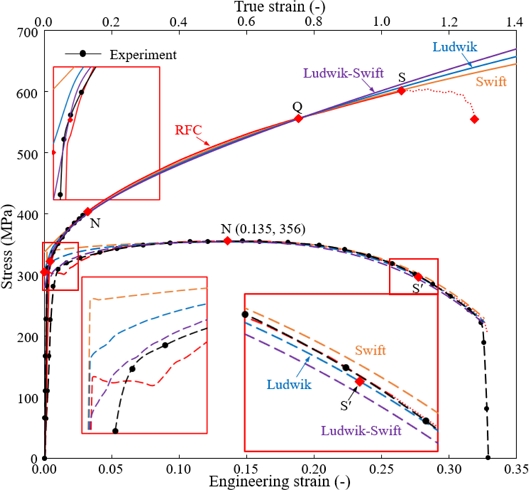
Fig. 9 Comparison of flow stresses models (Assumed yield strength = 280 MPa) and their corresponding tensile test predictions of theLudwik, Voce and Ludwik-Voce models with an emphasis on the point Q

Fig. 10 Comparison of flow stresses models (Assumed yield strength = 280 MPa) and their corresponding tensile test predictions of the Swift, Voce and Swift-Voce models with an emphasis on the point Q
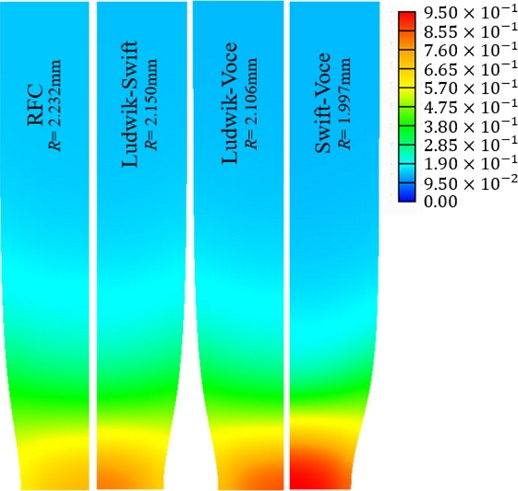
유동선도상의 점 S까지 실행한 인장시험의 예측 결과(
Fig. 11)를 분석한
Table 4에서 네킹점의 인장시험 시편 반지름의 비교 수치를 살펴보면 RFC의 적용 결과에 가장 근접한 모델이 Ludwik-Swift 모델이다. 이 혼합 유동모델을 사용하여 예측한 인장시험의 오차는 공칭변형률 0.29에서 최대 2.1%로 나타났다.
Fig. 11 Deformed shapes with effective strains of the tensile test at the point S’, predicted using the blended flow models (Assumed yield strength = 280 MPa) and RFC. R means the neck radius

Table 4 Comparison of contracted specimen radius and effective strain after tensile test simulations in which RFC and 3 different blended flow stress model were applied (Y0 = 280 MPa)
Table 4
|
Model |
Max.
Strain |
Radius at the neck
[mm] |
Difference with respect to
RFC [%] |
Flow stress error at S
to RFC [%] |
Tensile load error at S’ to
experiment [%] |
|
RFC |
0.729 |
2.232 |
- |
- |
0.1 |
|
Ludwik-Swift |
0.813 |
2.150 |
3.7 |
1.9 |
-1.8 |
|
Ludwik-Voce |
0.855 |
2.106 |
5.6 |
3.7 |
-5.4 |
|
Swift-Voce |
0.955 |
1.997 |
10.5 |
22.0 |
-6.4 |
그러나 단일 유동모델 중에서 네킹점 이후에 가장 우수한 정확도를 보인 Ludwik 모델의 오차인 0.8%에는 못 미친다. 그리고 이것은 항복강도 305 MPa을 적용한 Ludwik-Voce 모델의 최대 오차 1.6%보다 악화된 결과이다. 따라서 저변형률 구간에서의 정확도 개선에도 불구하고 전체적으로는 유동모델의 정확도가 약간 하락했음을 의미한다. 그러나 혼합변수 하나의 추가와 간단한 수계산으로 유동곡선 전체(
Fig. 1에서 항복점에서 점 S 또는 S’까지)에 대해서 인장시험 결과(공칭응력-변형률)를 기준으로 최대 오차가 2.1% 이하로 통제가 된 것은 정확성과 적용성 양면에서 유의미하다고 할 수 있다.
4. 토의
(1) 혼합 유동모델은 그 유용성에 비하여 기초 및 응용 연구가 부진하다. 그 원인 중의 하나는 인장시험에서 발생하는 포스트-네킹 변형경화에 관한 연구의 어려움이다. 혼합 유동모델은 주로 판재소성가공 분야에서 저변형률에서의 유연한 유동곡선의 표현을 위하여 연구되었다. 대부분 Voce 모델 또는 그 파생모델과 다른 기초 유동모델 간의 혼합이 주류를 형성하였다. 그 결과, 혼합 유동모델의 유용성이 과소평가되어 왔다.
(2) Voce 모델의 특징은 점근 응력에 있다. 이 점근 응력으로 인하여 고변형률에서 변형경화능을 표현하는데 한계가 있다. Voce 모델이 사용된 혼합 유동모델은 다소 가변적일 수밖에 없는 항복강도 등의 조건에 민감하게 변하는 특징이 확인되었다.
(3) 특히, 혼합 유동모델에 관한 기존의 연구는 그것이 두 기초 유동모델의 내분점(0과 1 사이의 혼합변수 조건)으로 결정된다는 것을 전제로 한 것으로 판단된다. 이것은 제한된 저변형률에 대해서 Voce 모델이 혼합 유동모델의 기초 유동모델 중의 하나로 사용된 배경일 것으로 짐작이 된다.
(4) 추가적으로 선택한 변형률에서 기초 유동모델의 응력이 목표 유동곡선을 기준으로 한쪽에 치우쳐 있을 경우 외삽에 의해 그 점에서의 응력 요구조건을 만족시켜야 한다. 이때, 이 연구에서 사용한 전형적인 변형경화 재료의 경우 Ludwik-Swift 혼합 유동모델은 비교적 안정적인 결과를 보였다. 이것은 Ludwik 모델과 Swift 모델이 변형경화 재료의 변형경화지수의 측면에서 상호 보완 관계에 있기 때문이다.
(5) Ludwik 모델의 경우 고변형경화 재료에서 상대적으로 큰 변형경화지수를 갖는다. 외삽으로 구성된 혼합 유동모델의 Ludwik 의존도가 클 경우 고변형률에서 유동응력의 증가가 다소 클 수 있다. 이러한 문제의 해결을 위해서 적절한 대표 변형률 또는 특정점의 선택이 필요하다.
(6) 2개의 기초 유동모델을 혼합하는 경우, 6개(Hollomon 모델을 포함할 때) 또는 7개의 상수(유동상수와 혼합상수)의 결정이 필요하므로 실용성 측면에서 복잡하게 보일 수가 있다. 그러나 각 기초 유동모델의 유동상수는 Considère 조건과 선택된 점의 정보로부터 독자적으로 결정되고,
식(5)부터
식(7)에서 정의 된 혼합변수는 이들과 무관하게 간단한 수 계산으로 구해진다. 따라서 기존의 방식과는 달리 제안된 혼합 유동모델에서 유동상수와 혼합변수의 결정은 용이하다.
5. 결론
상온에서 재료의 유동특성에 관한 기존 연구들이 대부분 네킹점의 중요성을 과소평가하는 경향이 있었다. 최근 소성가공 공정의 고정도 해석과 충돌 해석 등으로 인하여 네킹 해석의 중요성이 부각되었고, DIC 등의 실험적 방법이 뒷받침되면서 관련 연구가 활기를 띠고 있다. 이러한 응용 연구의 활성화를 위한 유연한 재료모델이 절실하다. 이러한 요구를 해결하는 데 있어 혼합 유동모델의 유용성과 그 활용 방안을 제시하였다.
혼합 유동모델에 사용된 기초 유동모델이 네킹점(인장강도와 Considère 조건)과 유동곡선 상의 특정점을 만족시킬 경우 혼합변수들의 합이 1이 된다는 전제하에, 혼합 유동모델은 그 네킹점과 특정점을 자동적으로 만족시킨다. 이것은 혼합변수 하나의 독립적 결정을 통하여 손쉽게 추가된 하나의 특정점을 만족시킬 수 있다. 이러한 장점들을 활용한 혼합 유동모델의 구성 방법이 확립되었다.
Ludwik-Swift 모델은 고변형률에서 전형적인 변형경화 소재에 적합한 혼합 유동모델로 평가되었다. 특히 외삽을 해야 하는 경우에도 관심 영역의 변형률 범위에서 신뢰할만한 결과를 나타내었다. Ludwik과 Swift 모델이 전형적인 변형경화 재료의 혼합 유동모델 목적으로 잘 어울리는 이유는 유사한 유동곡선의 패턴을 가지면서 동시에 변형률 경화 지수의 차이가 크다는 데 있다. 반면, 기존 연구에서 주로 사용된 Voce 모델은 이 유동모델이 갖는 점근 응력의 특성으로 인하여 단조의 고변형률 조건에 부적합한 것으로 평가되었다.
ACKNOWLEDGMENTS
본 연구는 2022년도 정부의 재원으로 한국산업기술평가관리원(KEIT)과 한국에너지기술평가원(KETEP)의 지원을 받아 수행된 연구임(정밀 냉간단조의 지능화 및 스마트화를 위한 금형 수명 사전예지 시스템의 개발및 응용, No. 20003950) (자원순환(재제조)산업 고도화 인력양성, No. 20214000000520).
REFERENCES
- 1.
Eom, J., Son, Y., Jeong, S., Ahn, S., Jang, S., Yoon, D., Joun, M., (2014), Effect of strain hardening capability on plastic deformation behaviors of material during metal forming, Materials & Design (1980-2015), 54, 1010-1018.
10.1016/j.matdes.2013.08.101
- 2.
Lee, S., Lee, J., Joun, M., (2020), On critical surface strain during hot forging of lubricated aluminum alloy, Tribology International, 141, 105855.
10.1016/j.triboint.2019.105855
- 3.
Liang, R., Khan, A. S., (1999), A critical review of experimental results and constitutive models for BCC and FCC metals over a wide range of strain rates and temperatures, International Journal of Plasticity, 15(9), 963-980.
10.1016/S0749-6419(99)00021-2
- 4.
Kreyca, J. F., (2017), State parameter based modelling of stress-strain curves in aluminium alloys, Ph.D. Thesis, Technische Universitat Wien.
10.1016/j.ijplas.2018.01.001
- 5.
Tu, S., Ren, X., He, J., Zhang, Z., (2020), Stress-strain curves of metallic materials and post-necking strain hardening characterization: A review, Fatigue & Fracture of Engineering Materials & Structures, 43(1), 3-19.
10.1111/ffe.13134
- 6.
Paul, S. K., Roy, S., Sivaprasad, S., Bar, H., Tarafder, S., (2018), Identification of post-necking tensile stress-strain behavior of steel sheet: An experimental investigation using digital image correlation technique, Journal of Materials Engineering and Performance, 27(11), 5736-5743.
10.1007/s11665-018-3701-3
- 7.
Kim, M., Gu, B., Hong, S., (2020), Determination of post-necking stress-strain relationship for zirconium low-oxidation based on actual cross-section measurements by DIC, Journal of Mechanical Science and Technology, 34(10), 4211-4217.
10.1007/s12206-020-0913-x
- 8.
Lin, S.-H., Chen, D.-C., Chai, U.-C., Tzou, G.-Y., (2020), FEM analysis and experiment validation on multi-pass forging of torx round flange bolt, International Journal of Automotive Technology, 21(5), 1113-1119.
10.1007/s12239-020-0105-9
- 9.
Byun, J. B., Razali, M. K., Lee, C. J., Seo, I. D., Chung, W. J., Joun, M. S., (2020), Automatic multi-stage cold forging of an SUS304 ball-stud with a hexagonal hole at one end, Materials, 13(22), 5300.
10.3390/ma13225300
- 10.
Jo, A. R., Jeong, M. S., Lee, S. K., Moon, Y. H., Hwang, S. K., (2021), Multi-stage cold forging process for manufacturing a high-strength one-body input shaft, Materials, 14(3), 532.
10.3390/ma14030532
- 11.
Mirone, G., (2004), A new model for the elastoplastic characterization and the stress-strain determination on the necking section of a tensile specimen, International Journal of Solids and Structures, 41(13), 3545-3564.
10.1016/j.ijsolstr.2004.02.011
- 12.
Bridgman, P. W., (1964), Studies in large plastic flow and fracture, Harvard University Press.
10.4159/harvard.9780674731349
- 13.
Joun, M., Eom, J. G., Lee, M. C., (2008), A new method for acquiring true stress–strain curves over a large range of strains using a tensile test and finite element method, Mechanics of Materials, 40(7), 586-593.
10.1016/j.mechmat.2007.11.006
- 14.
Kamaya, M., Kawakubo, M., (2011), A procedure for determining the true stress–strain curve over a large range of strains using digital image correlation and finite element analysis, Mechanics of Materials, 43(5), 243-253.
10.1016/j.mechmat.2011.02.007
- 15.
Hering, O., Kolpak, F., Tekkaya, A. E., (2019), Flow curves up to high strains considering load reversal and damage, International Journal of Material Forming, 12(6), 955-972.
10.1007/s12289-018-01466-z
- 16.
Eom, J., Kim, M., Lee, S., Ryu, H., Joun, M., (2014), Evaluation of damage models by finite element prediction of fracture in cylindrical tensile test, Journal of Nanoscience and Nanotechnology, 14(10), 8019-8023.
10.1166/jnn.2014.9472
- 17.
Considère, M., (1885), Mémoire sur l'emploi du fer et de l'acier dans les constructions, Vue Ch. Dunod.
- 18.
Ludwik, P., (1909), Elemente der technologischen Mechanik, Springer.
10.1007/978-3-662-40293-1
- 19.
Voce, E., (1948), The relationship between stress and strain for homogeneous deformation, Journal of the Institute of Metals, 74, 537-562.
- 20.
Hollomon, J. H., (1945), Tensile deformation, Aime Trans, 12(4), 1-22.
- 21.
Swift, H. W., (1952), Plastic instability under plane stress, Journal of the Mechanics and Physics of Solids, 1(1), 1-18.
10.1016/0022-5096(52)90002-1
- 22.
Lin, Y., Chen, X.-M., (2011), A critical review of experimental results and constitutive descriptions for metals and alloys in hot working, Materials & Design, 32(4), 1733-1759.
10.1016/j.matdes.2010.11.048
- 23.
Voyiadjis, G. Z., Abed, F. H., (2005), Microstructural based models for bcc and fcc metals with temperature and strain rate dependency, Mechanics of Materials, 37(2-3), 355-378.
10.1016/j.mechmat.2004.02.003
- 24.
El-Magd, E., Abouridouane, M., (2006), Characterization, modelling and simulation of deformation and fracture behaviour of the light-weight wrought alloys under high strain rate loading, International Journal of Impact Engineering, 32(5), 741-758.
10.1016/j.ijimpeng.2005.03.008
- 25.
Bergström, Y., Granbom, Y., Sterkenburg, D., (2010), A dislocation-based theory for the deformation hardening behavior of DP steels: Impact of martensite content and ferrite grain size, Journal of Metallurgy, 2010, 647198.
10.1155/2010/647198
- 26.
Kim, Y. S., Pham, Q. T., Kim, C. I., (2017), New stress-strain model for identifying plastic deformation behavior of sheet materials, Journal of the Korean Society for Precision Engineering, 34(4), 273-279.
10.7736/KSPE.2017.34.4.273
- 27.
Omer, K., Kim, S., Butcher, C., Worswick, M., (2017), Characterizing the constitutive properties of AA7075 for hot forming, Journal of Physics: Conference Series, 896, 012054.
10.1088/1742-6596/896/1/012054
- 28.
Razali, M. K., Joun, M. S., Chung, W. J., (2021), A novel flow model of strain hardening and softening for use in tensile testing of a cylindrical specimen at room temperature, Materials, 14(17), 4876.
10.3390/ma14174876
- 29.
Sung, J. H., Kim, J. H., Wagoner, R., (2010), A plastic constitutive equation incorporating strain, strain-rate, and temperature, International Journal of Plasticity, 26(12), 1746-1771.
10.1016/j.ijplas.2010.02.005
- 30.
Banabic, D., Sester, M., (2012), Influence of material models on the accuracy of the sheet forming simulation, Materials and Manufacturing Processes, 27(3), 273-277.
10.1080/10426914.2011.578005
- 31.
Hockett, J., Sherby, O., (1975), Large strain deformation of polycrystalline metals at low homologous temperatures, Journal of the Mechanics and Physics of Solids, 23(2), 87-98.
10.1016/0022-5096(75)90018-6
- 32.
Lemoine, X., Sriram, S., Kergen, R., (2011), Flow curve determination at large plastic strain levels to accurately constitutive equations of AHSS in forming simulation, Proceedings of the AIP Conference, 1417-1422.
10.1063/1.3589715
- 33.
Joun, M., Choi, I., Eom, J., Lee, M., (2007), Finite element analysis of tensile testing with emphasis on necking, Computational Materials Science, 41(1), 63-69.
10.1016/j.commatsci.2007.03.002
- 34.
Joun, M.-S., Razali, M. K., Jee, C.-W., Byun, J.-B., Kim, M.-C., Kim, K.-M., (2022), A review of flow characterization of metallic materials in the cold forming temperature range and its major issues, Materials, 15(8), 2751-2782.
10.3390/ma15082751
- 35.
Joun, M. S., Jeong, S. W., Park, Y. T., Hong, S. M., (2021), Experimental and numerical study on shearing of a rod to produce long billets for cold forging, Journal of Manufacturing Processes, 62, 797-805.
10.1016/j.jmapro.2020.12.062
Biography
- Chang Woon Jee
Senior researcher of Technical Research Labs, POSCO, Gwang-yang, South Korea. His research interests include characterization of material properties and automotive steel processing.
- Su Min Ji
MS candidate in the Department of Mechanical and Aerospace Engineering, Gyeongsang National University. His research interest is material characterization, material modeling and metal forming simulation.
- Jong Bok Byun
Training researcher of Engineering Research Institute, Gyeongsang National University. His research interest is material modeling, finite element simulation of metal forming processes and their process optimal design.
- Man Soo Joun
Professor in the Department of Mechanical and Aerospace Engineering, Gyeongsang National University. His research interest is metal forming simulation technologies with an emphasis on their industrial applications, specifically including flow analysis, heat transfer analysis, metallurgical analysis, process modelling and design optimization and flow and metallurgical modellings.