ABSTRACT
In this work, Mg1-xZnxO thin films were deposited on glass substrates by the pneumatic spray technique at 450°C using a 0.15 M precursor solution of magnesium acetate and zinc acetate. The effect of Zn content (x = 0, 0.3, 0.5, and 0.7%) on the structural, morphological, optical, and electrical properties of the films was examined. XRD analysis showed that all films adopted a cubic MgO structure with diffraction peaks from the (111), (200), and (220) planes, and the crystallite size grew from 8.12 to 12.49 nm as the Zn content increased. SEM images indicated that moderate Zn incorporation improved film homogeneity, whereas higher Zn contents promoted agglomeration and surface roughening. The films transmitted well in the visible region, and the optical band gap widened from 3.56 to 3.93 eV at x = 0.3. The Urbach energy also rose with Zn content, reaching a maximum of 0.695 eV at x = 0.7, which indicates greater structural disorder. FTIR spectra confirmed that Zn incorporation modifies the chemical bonding network. The sheet resistance increased markedly with Zn content, demonstrating the strong influence of Zn doping on the optical and electrical properties of MgO thin films.
-
KEYWORDS: Mg1-xZnxO thin films, Zinc doping, Spray pneumatic deposition, Structural properties, Optical properties, Electrical properties
-
KEYWORDS: Mg1-xZnxO박막, 아연 도핑, 분무식 공압 증착, 구조적 특성, 광학적 특성, 전기적 특성
1. Introduction
Mixed metal oxides have attracted increasing research attention and are widely used in physics, chemistry, materials science, and engineering. The combination of two or more metals in an oxide matrix can produce materials with novel physical and chemical properties, leading to relatively higher performance in various technological applications [
1-
5]. Alloying or combining wide-band gap semiconductors makes them attractive for various technological applications, such as photovoltaics and optoelectronic devices [
6-
8]. Among them, MgO is one of the most extensively studied metal oxides due to its ease of synthesis and doping.
MgO nanostructures were synthesized by various synthetic methods including Spray Pyrolysis Technique [
9], sol-gel method and solid state method [
10], ultrasonic [
11], combustion method [
12] hydrothermal, spin-coated [
13], laser ablation technique [
14] inkjet technique [
15] hydrothermal [
16]. Spray pyrolyses provides a number of benefits over the techniques outlined above. It does not necessitate the use of costly vacuum equipment. It offers high-speed deposition and high-quality substrates of layers with diverse precursors on large-area substrates.
The objective of this work is to study the effect of zinc doping concentration on the structural, morphological, optical, and electrical properties of Mg1-xZnxO thin films. The experimental results are discussed in terms of crystallite size, microstrain, dislocation density, optical band gap, Urbach energy and electrical resistivity as influenced by zinc doping Mg1-xZnxO thin films.
In this work, the pneumatic spray technique was used to deposit Mg
1-xZn
xO alloy thin films due to its advantages, including ease of operation and low cost. On a molecular level, precise control and good homogenization are essential [
17]. For this purpose, Mg
1-xZn
xO thin films were synthesized with different Zn doping concentrations (x = 0, 0.3, 0.5 and 0.7%). Moreover, Zn
2+ ions can be successfully incorporated into the MgO lattice due to the close similarity between the ionic radius of Mg
2+ (0.57 Å) and that of Zn
2+ (0.60 Å) [
18].
2. Experimental Procedure
2.1 Deposition Conditions
The spray solution of Mg1-xZnxO was prepared by dissolving 0.15 M precursor consisting of magnesium acetate [Mg(CH3COO)2, 4H2O] and Zinc acetate dehydrate [Zn(CH3COO)2, 2H2O]. Hence Zn-doped MgO thin films with various Zn concentrations (x = 0, 0.3, 0.5 and 0.7%) were prepared. The precursors were mixed in distilled water until a clear and homogeneous solution was obtained after stirring for 30 min. The glass substrates were then cleaned using alcohol and acetone. The resulting solution was sprayed onto heated glass substrates maintained at a substrate temperature of 450oC using the pneumatic spray technique.
2.2 Characterization Techniques
The crystalline microstructure of the Mg1-xZnxO thin films was analyzed using X-ray diffraction (XRD) using an ARLTM EQUINOX 100 diffractometer with CuKα radiation (λ = 1.5406 Å) over the 2θ range of 20–80o.
The surface morphology Mg1-xZnxO thin films was characterized by scanning electron microscopy (SEM) using a TESCAN VEGA3 microscope.
Optical properties were characterized using a Cary Series UV– Vis–NIR spectrophotometer.
The electrical resistance was determined by the four-point probe technique using current–voltage (I–V) measurements performed with a Keithley 2611B SourceMeter (SMU) on the film surface.
3. Results and Discussion
3.1 Study on Structural Properties of Mg1-xZnxO Thin Films
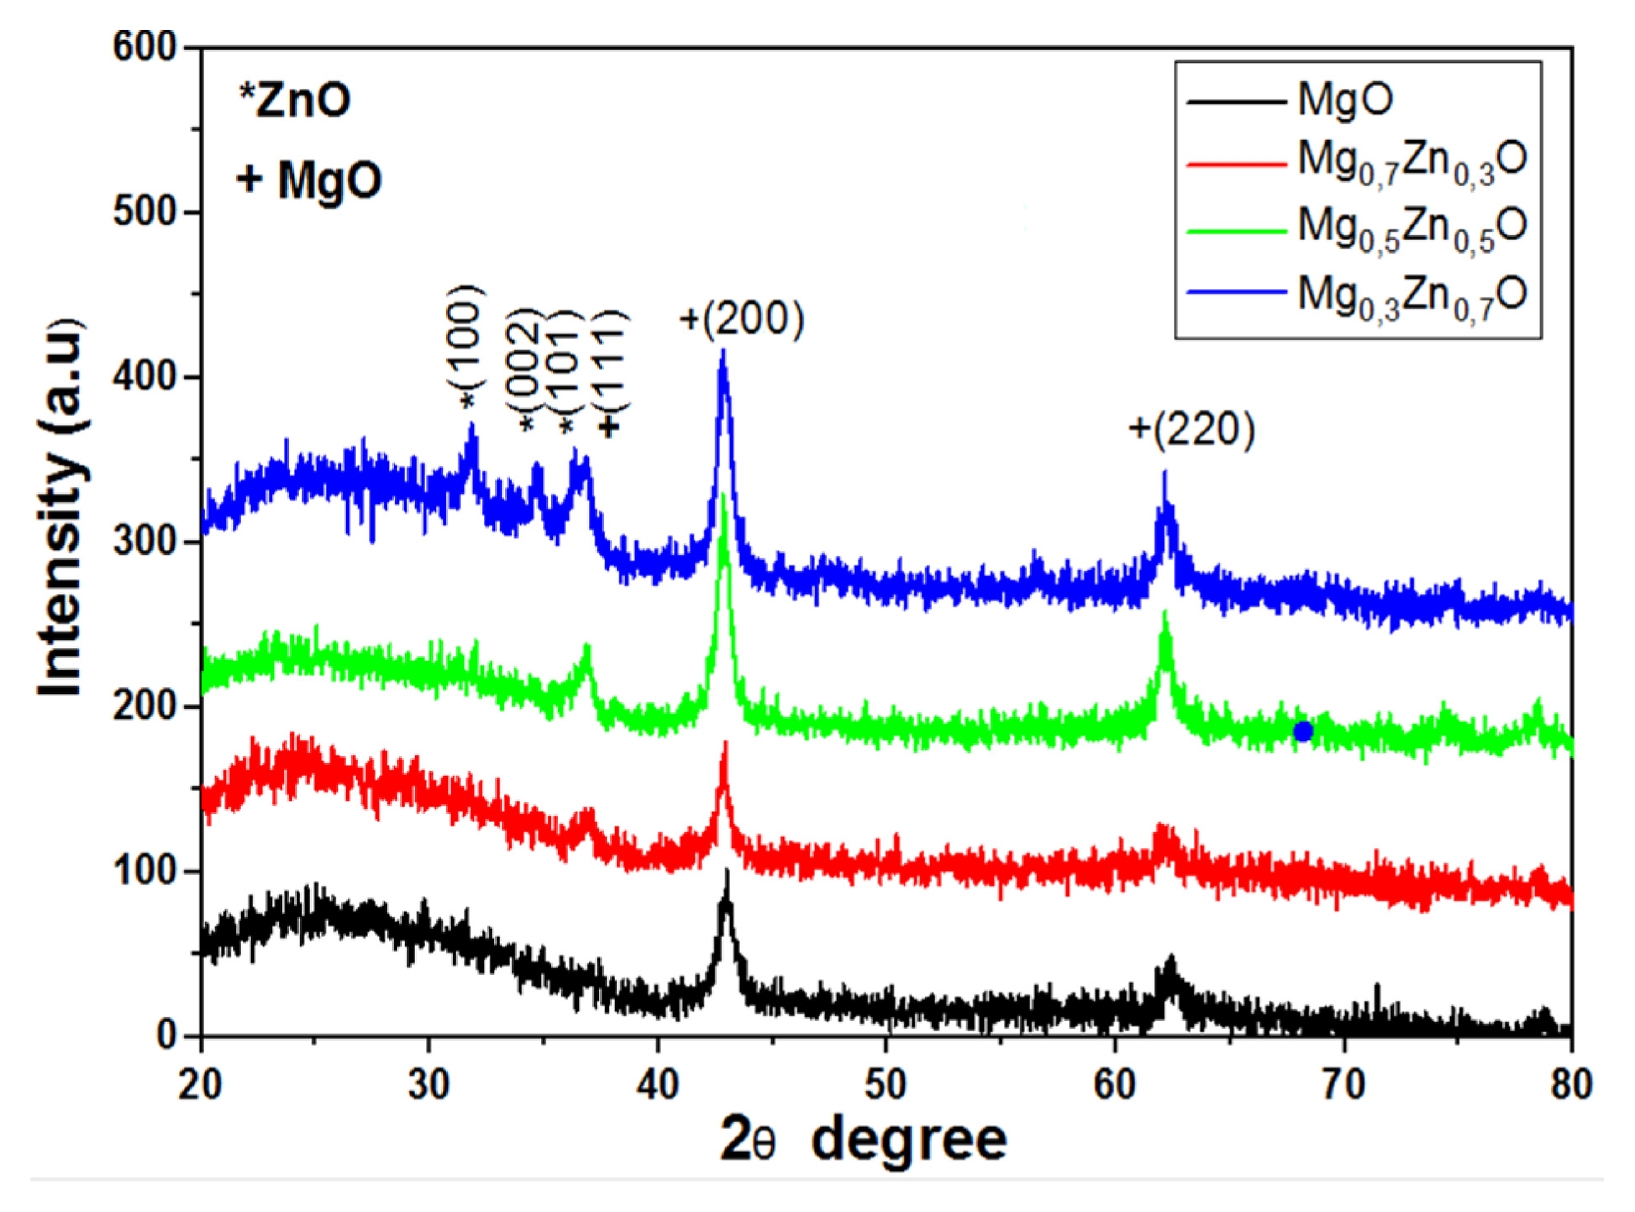
Fig. 1 Shows the X-ray diffraction patterns of Mg
1-xZn
xO thin films deposited at a substrate temperature of 450
oC for various Zn concentrations (x = 0, 0.3, 0.5 and 0.7%.). The films were synthesized using the pneumatic spray technique, The presence of diffraction peaks confirms the crystalline nature of the films. The peaks located at 2θ values of 36.93, 42.90, and 62.29
o correspond to the (111), (200), and (220) diffraction planes, respectively (JCPDS No. 01-078-0430) [
19], indicating the formation of cubic MgO phase. Furthermore, additional peaks observed at approximately 31.80, 34.50, and 36.40
o correspond to the (100), (002) and (101) planes of the hexagonal wurtzite ZnO structure (JCPDS No. 36-1451) [
11,
12]. These findings confirm the successful incorporation of Zn into the MgO lattice and the coexistence of MgO and ZnO phases in the Mg
1-xZn
xO thin films.
The diffraction intensity gradually increases with increasing Zn concentration, particularly for the Mg
0.5Zn
0.5O sample, suggesting improved in crystallinity and grain growth. The enhancement in peak sharpness and intensity indicates that Zn incorporation promotes better structural ordering within the films. This behavior suggests that most Zn
2+ ions are successfully incorporated into the MgO lattice. which can be explained by the close similarity between the ionic radii of Mg
2+ (R Mg
2+ = 0.57 Å) and Zn
2+ (R Zn
2+ = 0.60 Å), thereby minimizing lattice distortion [
19,
20]. In contrast, the undoped MgO film exhibits broader and weaker diffraction peaks, indicating smaller crystallite size and lower crystalline quality. Moreover, the slight shifts in peak intensity and position with Zn doping may be attributed to local structural rearrangements and defect-related effects induced by Zn
2+ incorporation into the MgO lattice. These findings confirm that Zn doping strongly influences the structural properties of MgO thin films and enhances their crystallization behavior.
Table 1 presents the XRD diffraction parameters for all diffraction peaks, including peak positions and interplanar spacing, based on different JCPDS standards.
The structure information corresponding to the cubic structure as well as the lattice constants can be calculated using
Eq. (1) [
21]:
where (hkl) is the Miller indices of the crystallographic planes, a is the lattice parameter and dhkl is the interplanar spacing.
However, the average crystallite size of Mg
1-xZn
xO thin films was determined using the Debye-Scherer formula (
Eq. (2)) [
22]:
where
D is the crystallite size,
λ is the X-ray wavelength (
λ = 1.5406 Ẵ),
β is the full width at half-maximum (FWHM), and
θ is the Bragg diffraction angle of the MgO peaks. The microstrain
ε, which decreases with increasing Zn doping concentration, was calculated using
Eq. (3) [
22]:
The dislocation density
δ, defined as the number of dislocation lines per unit area of the crystal, was calculated using the
Eq. (4) based on the crystallite size [
23]:
Table 2 summarizes the crystallite size, dislocation density, Lattice parameter and microstrain of Mg
1-xZn
xO thin films obtained from XRD analysis.
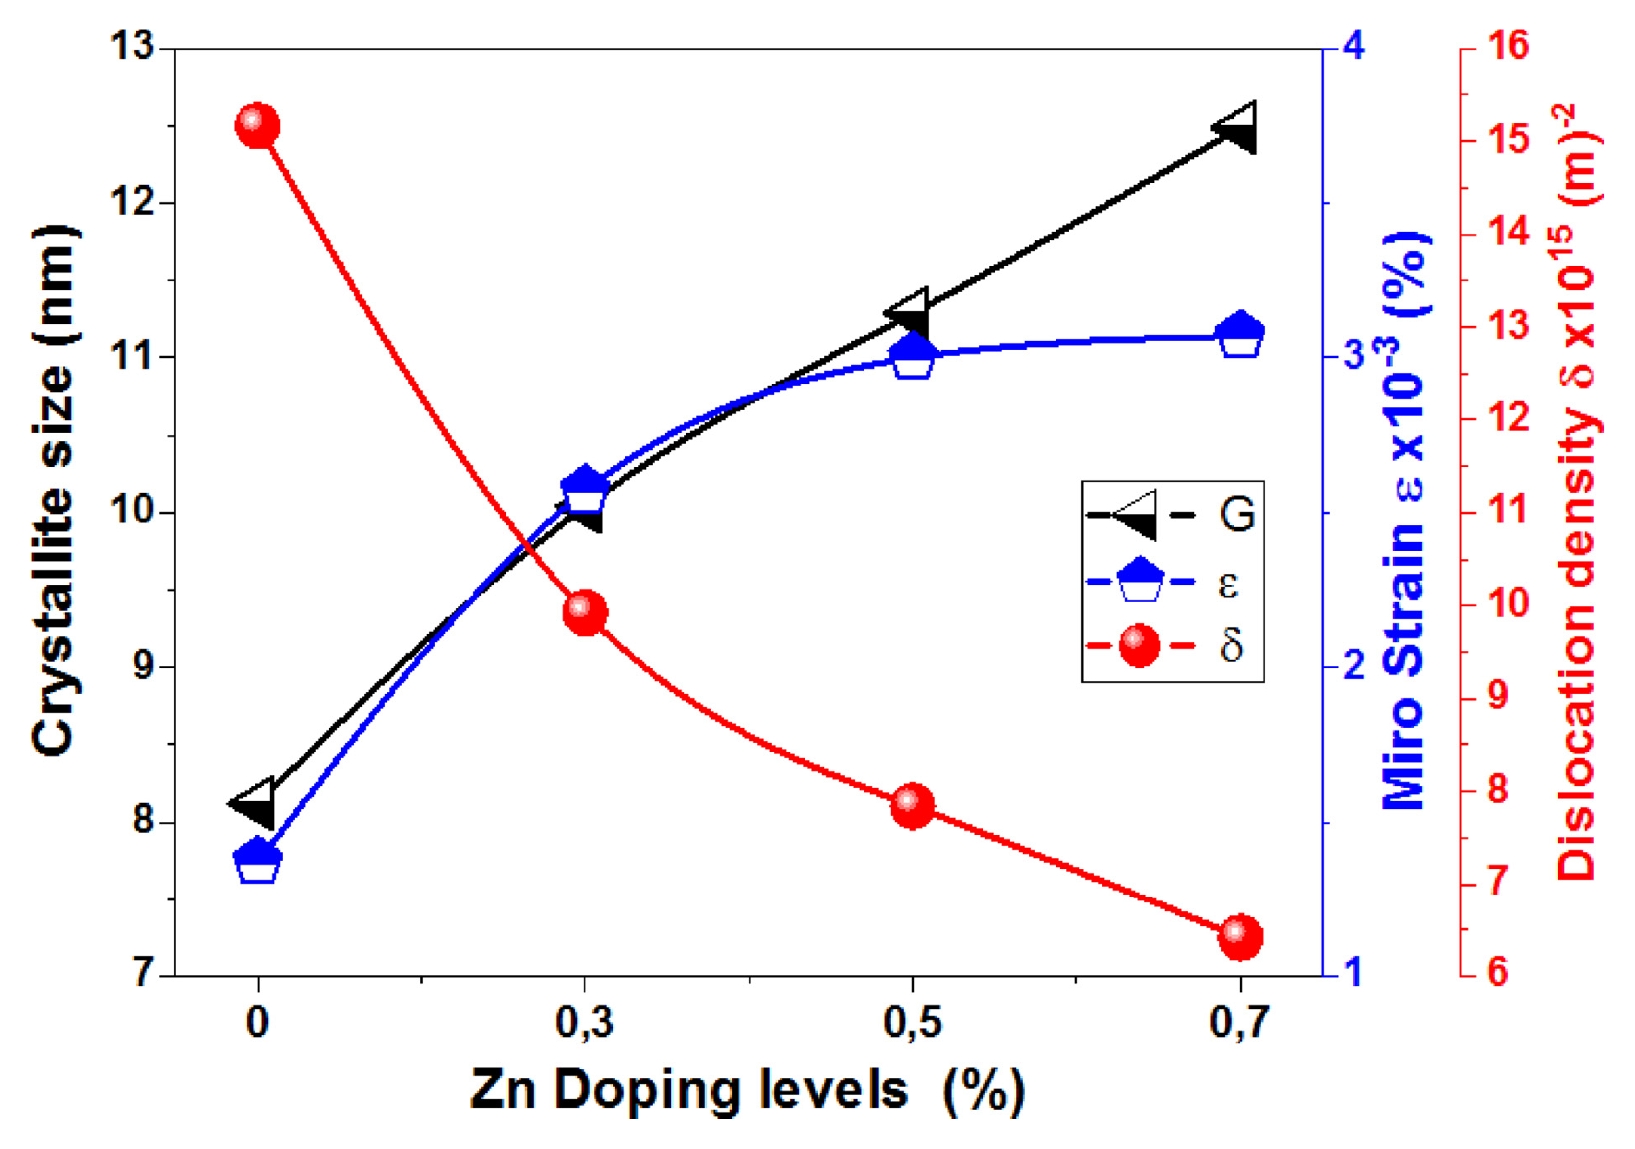
Fig. 2 illustrates the variation of crystallite size (
D), microstrain (
ε), and dislocation density (
δ ) of Mg
1-xZn
xO thin film as a function of Zn doping concentration (x = 0, 0.3, 0.5 and 0.7%). It can be observed that the crystallite size gradually increases from about 8.12 nm for x = 0 to 12.49 nm for x = 0.7% Zn. This increase indicates that Zn incorporation promotes crystal growth and improves the structural crystallinity of the thin films. The enhancement in crystallite size may be attributed to the close ionic radii of Mg
2+ and Zn
2+, which facilitates the substitution of Zn into the MgO lattice with minimal structural distortion. This result is in good agreement with previous reports [
24,
25]. Simultaneously, the microstrain increases significantly as the Zn concentration rises. The gradual increase in microstrain with Zn addition up to x = 0.7 is attributed to higher Zn incorporation, leading to local lattice distortions, defect formation, and increased structural disorder. Despite the similar ionic radii of Mg
2+ and Zn
2+, high doping levels induce cumulative lattice perturbations and microstrain. In contrast, the dislocation density significantly decreases from about 15.17 × 10
15 for x = 0 (MgO) to 6.41 × 10
15 for x = 0.7% Zn doping. Since dislocation density is inversely proportional to the square of crystallite size, the reduction in dislocation density confirms an improvement in structural quality and a decrease in crystalline defects with the addition of Zn. Consequently, Zn doping enhances the structural ordering of MgO thin films by promoting crystal growth and reducing defect density. Therefore, Zn ions occupy defect sites, facilitating grain boundary movement and increasing the grain growth rate [
26].
3.2 Study Morphology Properties of Mg1-xZnxO Thin Films
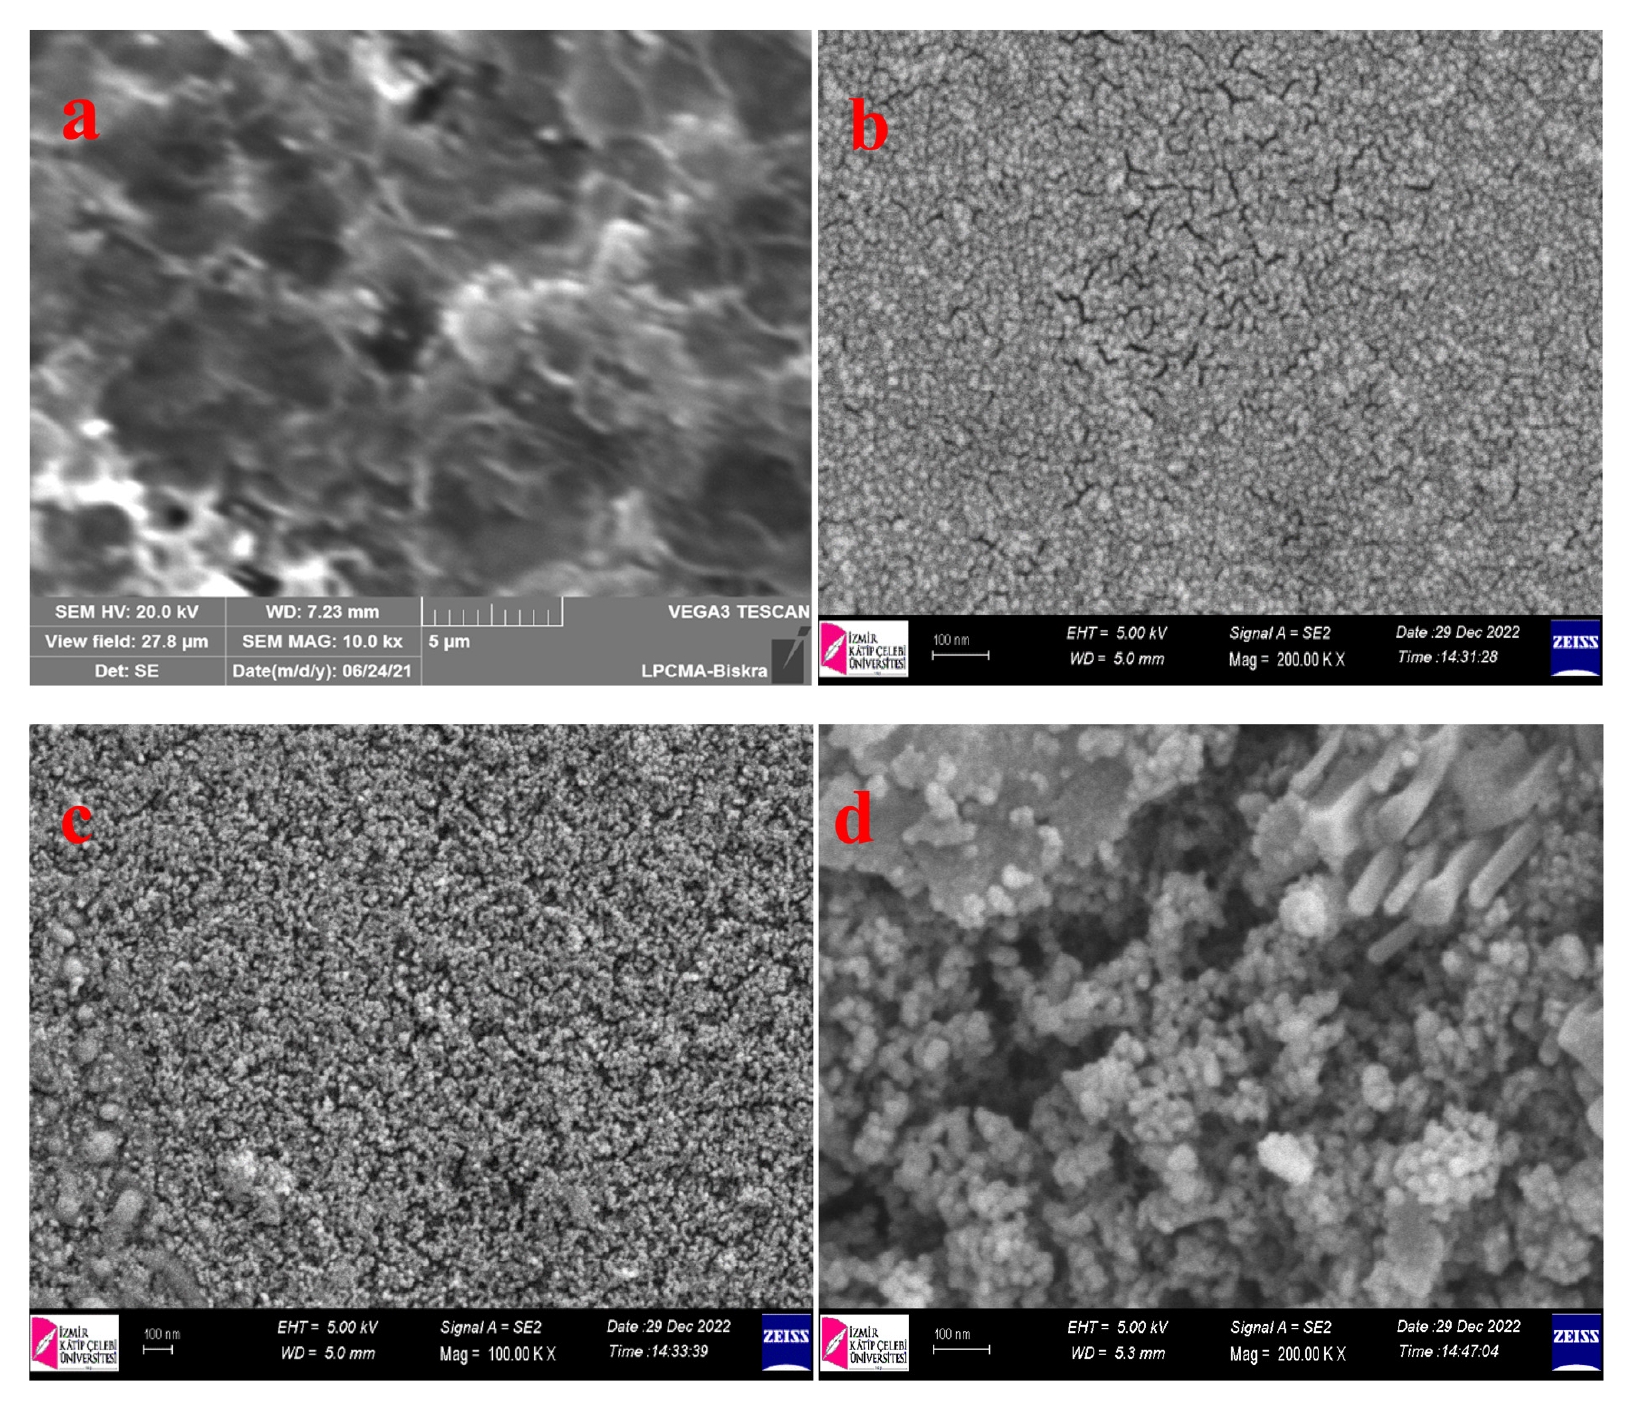
Fig. 3 shows the SEM surface morphology of Mg
1-xZn
xO thin films deposited at different Zn doping concentrations (x = 0, 0.3, 0.5 and 0.7%). The undoped MgO film (
Fig. 3(a)) exhibits a nonuniform surface characterized by irregularly distributed grains and noticeable agglomeration, suggesting relatively poor surface homogeneity. Additionally, some voids and porous regions are observed, which may be attributed to incomplete grain coalescence during the film growth process. With the introduction of Zn at x = 0.3 (
Fig. 3(b)), the film surface becomes more compact and homogeneous, characterized by fine and densely packed grains. This enhancement in surface uniformity indicates that the incorporation of Zn improves nucleation and facilitates better distribution of grains across the substrate surface. At x = 0.5 (
Fig. 3(c)), the film exhibits a highly dense and continuous morphology with smaller and more uniformly distributed grains. This behavior indicates improved crystallization and surface coverage, in agreement with the XRD results. Such a compact microstructure is expected to enhance the optical and electrical properties by reducing surface defects and minimizing grain boundary scattering. At the highest Zn concentration (x = 0.77), as shown in
Fig. 3(d), a significant change in morphology was observed, characterized by the emergence of larger agglomerated particles and rod-like structures characteristic of the ZnO phase [
27]. The surface exhibits increased roughness and decreased homogeneity compared to lower Zn concentrations. This behavior may result from excessive Zn incorporation, which can lead to grain coalescence, secondary phase formation, or abnormal crystal growth. In general, zinc doping with magnesium oxide significantly affects the surface morphology of thin films. Moderate zinc concentrations improve film cohesion and homogeneity. However, excessive zinc content leads to clumping and increased surface roughness. By comparing the visible grains to the 100 nm scale bar, the typical grain dimensions are 20 to 30 nm.
3.3 Study on Optical Properties of Mg1-xZnxO Thin Films
The optical properties are crucial for various applications. The measurement results demonstrate the relationships between transmittance and absorbance with wavelength in Mg
1-xZn
xO thin films that have different Zn concentrations (x = 0, 0.3, 0.5 and 0.7%). The effect of Zn concentration on optical parameters, including the absorption coefficient, optical energy gap, and Urbach energy was also investigated.
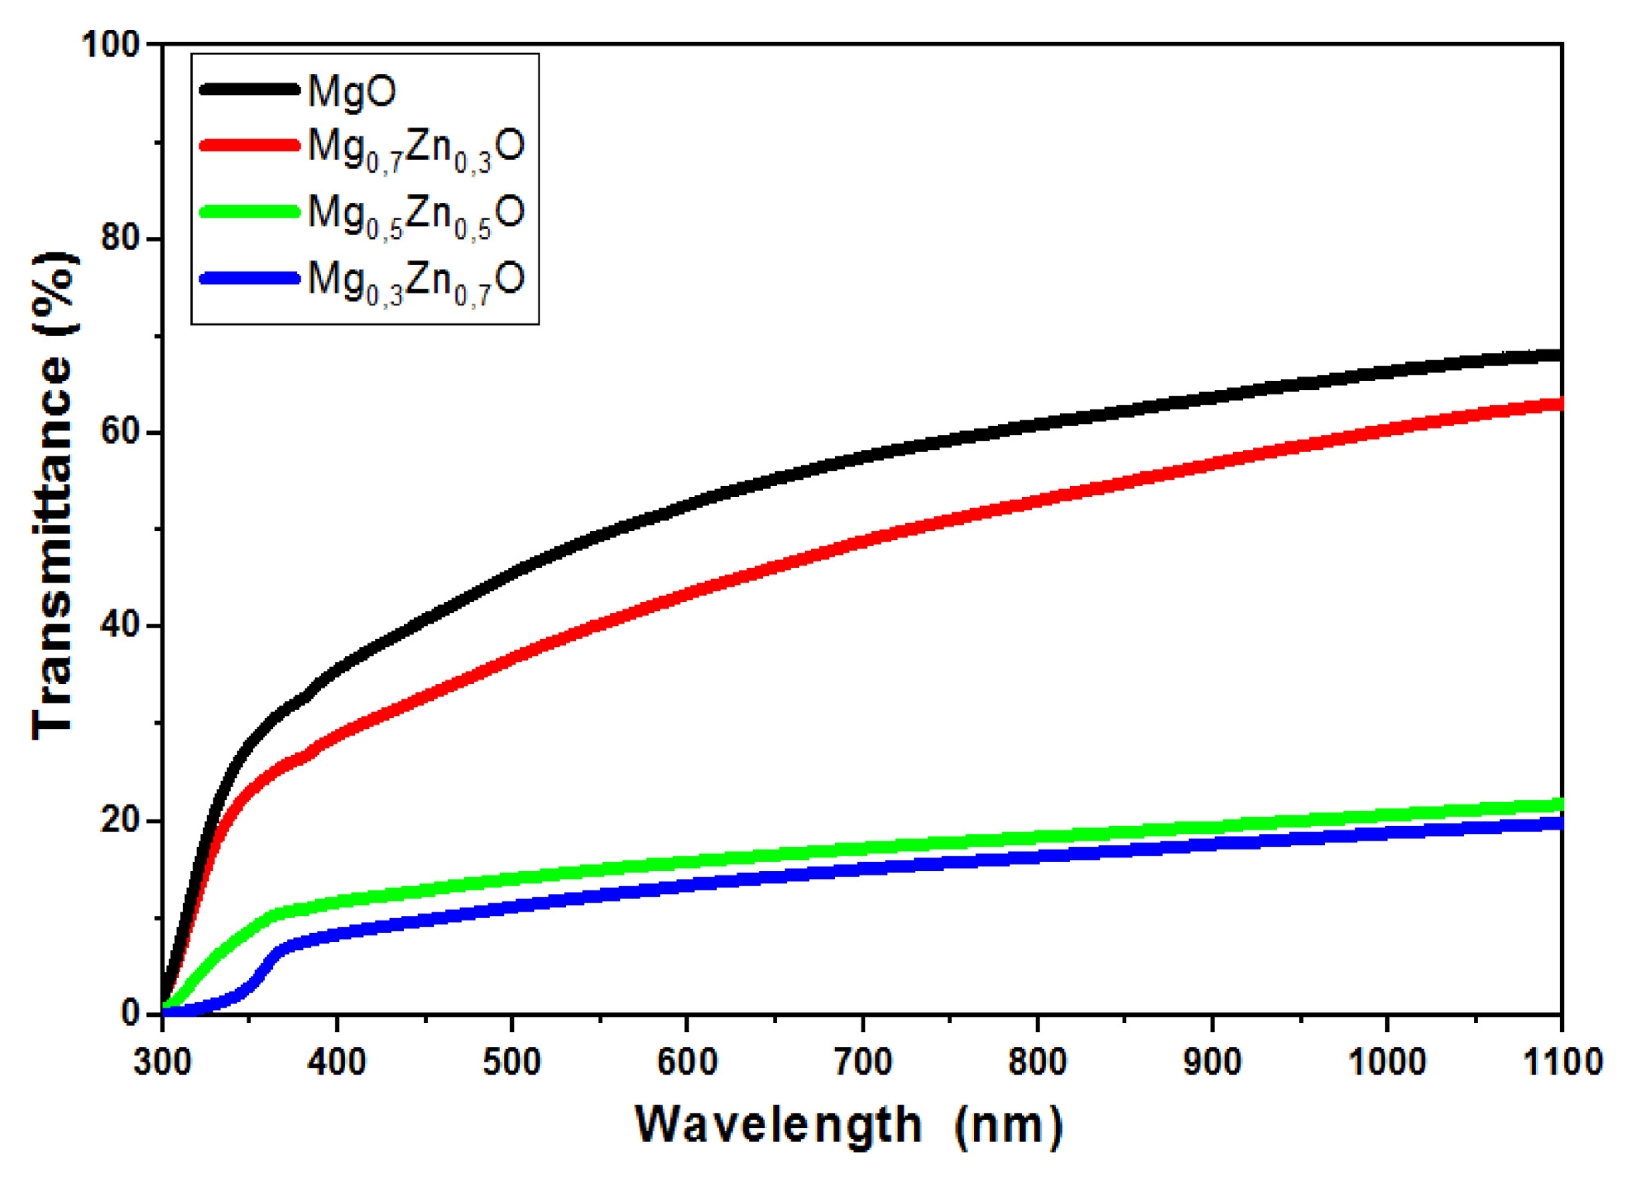
Fig. 4 shows the optical transmission spectra of Mg
1-xZn
xO thin films, which were deposited at a substrate temperature of 450
oC. As can be seen, the transmittance for all thin films decreases with decreasing wavelength in the range of 300 to 1,100 nm. The spectrum exhibits high transmittance in the visible region and low transmittance in the ultraviolet region. The transmittance of Mg
1-xZn
xO thin films decreased with the increase in the Zn doping concentration. The transmission value in the visible range (400–800 nm) varies from 15 to 60%, with the maximum transmittance observed in the thin films being approximately 60% at x = 0 of Zn. Previous studies have reported transmittance values ranging from 55% and 92% for similar films [
28].
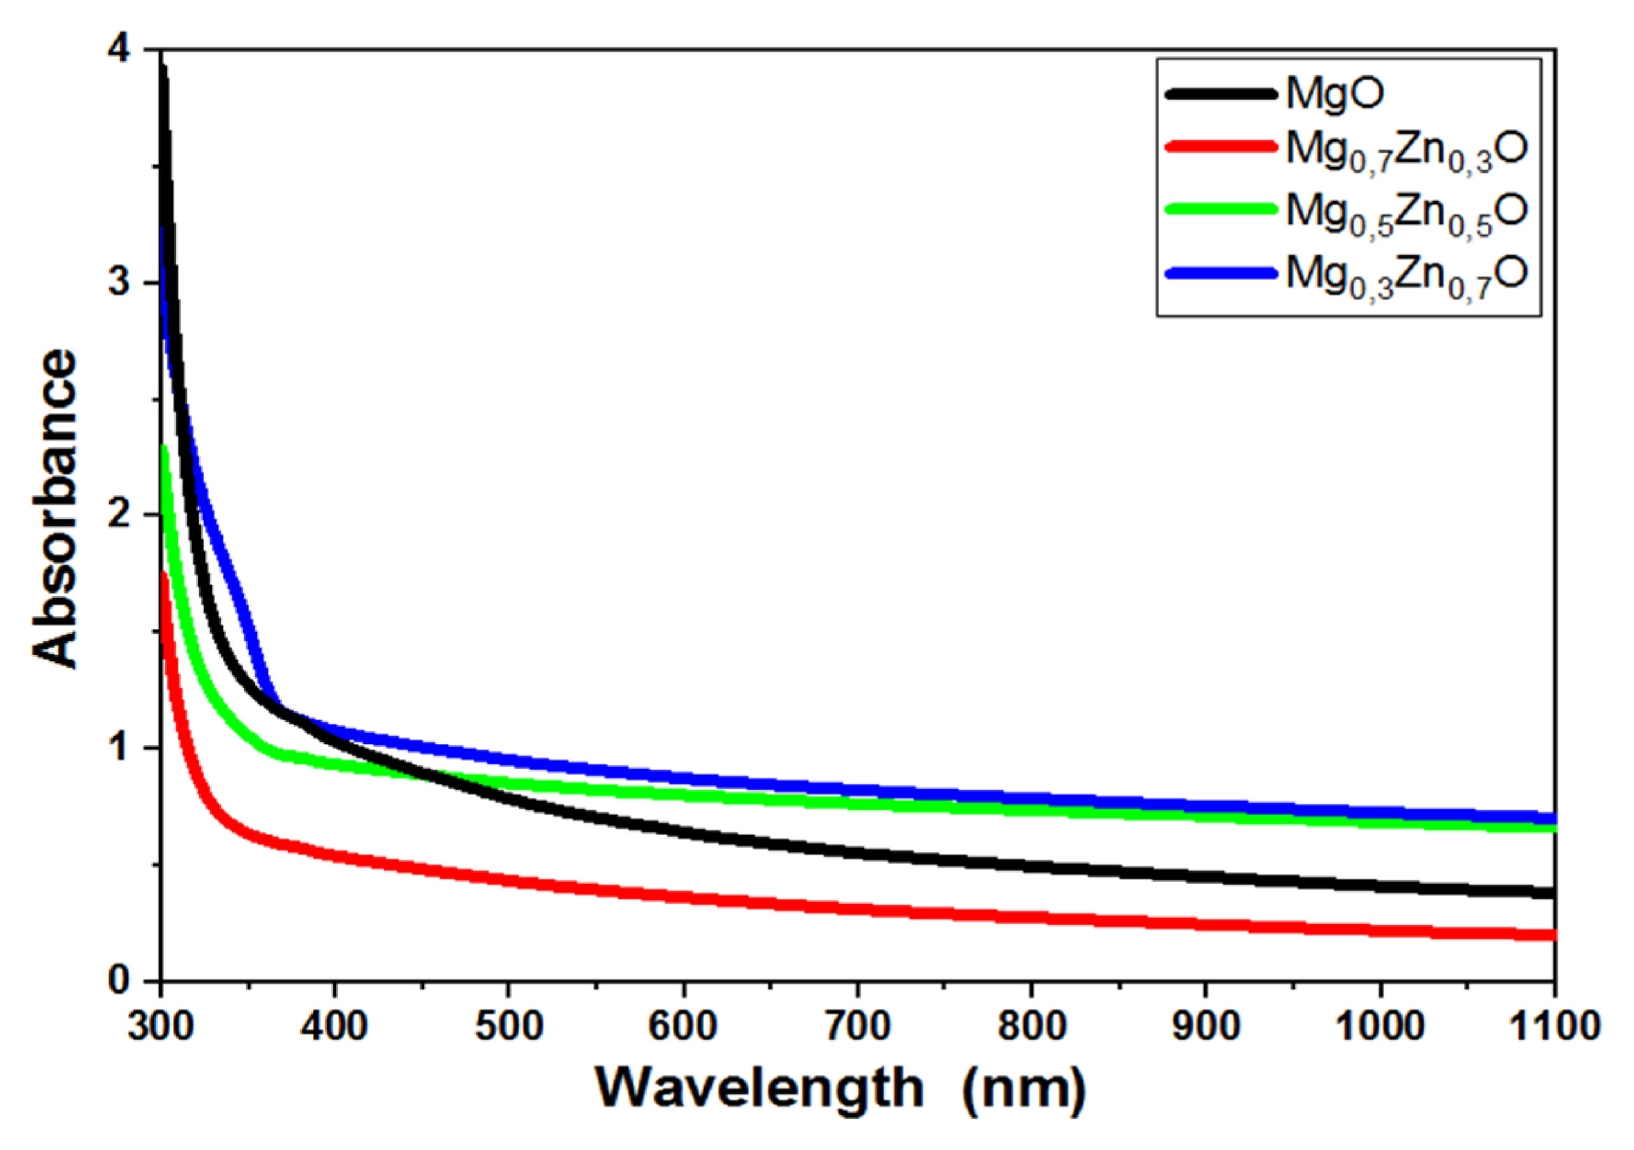
Fig. 5 presents the variation of absorbance spectra of Mg
1-xZn
xO thin films as a function of Zn concentration (x = 0, 0.3, 0.5 and 0.7%). As shown, the optical properties of MgO thin films are significantly influenced by the concentration of Zn doping. The highest absorption intensity is observed for the sample with x = 0.7. The absorption edge, which corresponds to the electronic transition from the valence band to the conduction band, is located in the range of 300–400 nm. A clear shift of the absorption edge toward longer wavelengths is observed, moving from 300 to 400 nm, indicating a red shift with increasing Zn concentration.
The optical band gap energy
Eg of Mg
1-xZn
xO thin films was determined using the Tauc relation, represented by the
Eq. (5) [
29]:
where
n is an integer that takes the value (1/2 or 2 for direct or indirect) transitions semiconductor material,
A is the absorbance,
α is the absorption coefficient,
d is the film thickness;
T is the transmission spectra of Mg
1-xZn
xO thin films,
hv represents the photo energy (
hv=1240λ(nm)),
C is a constant, and
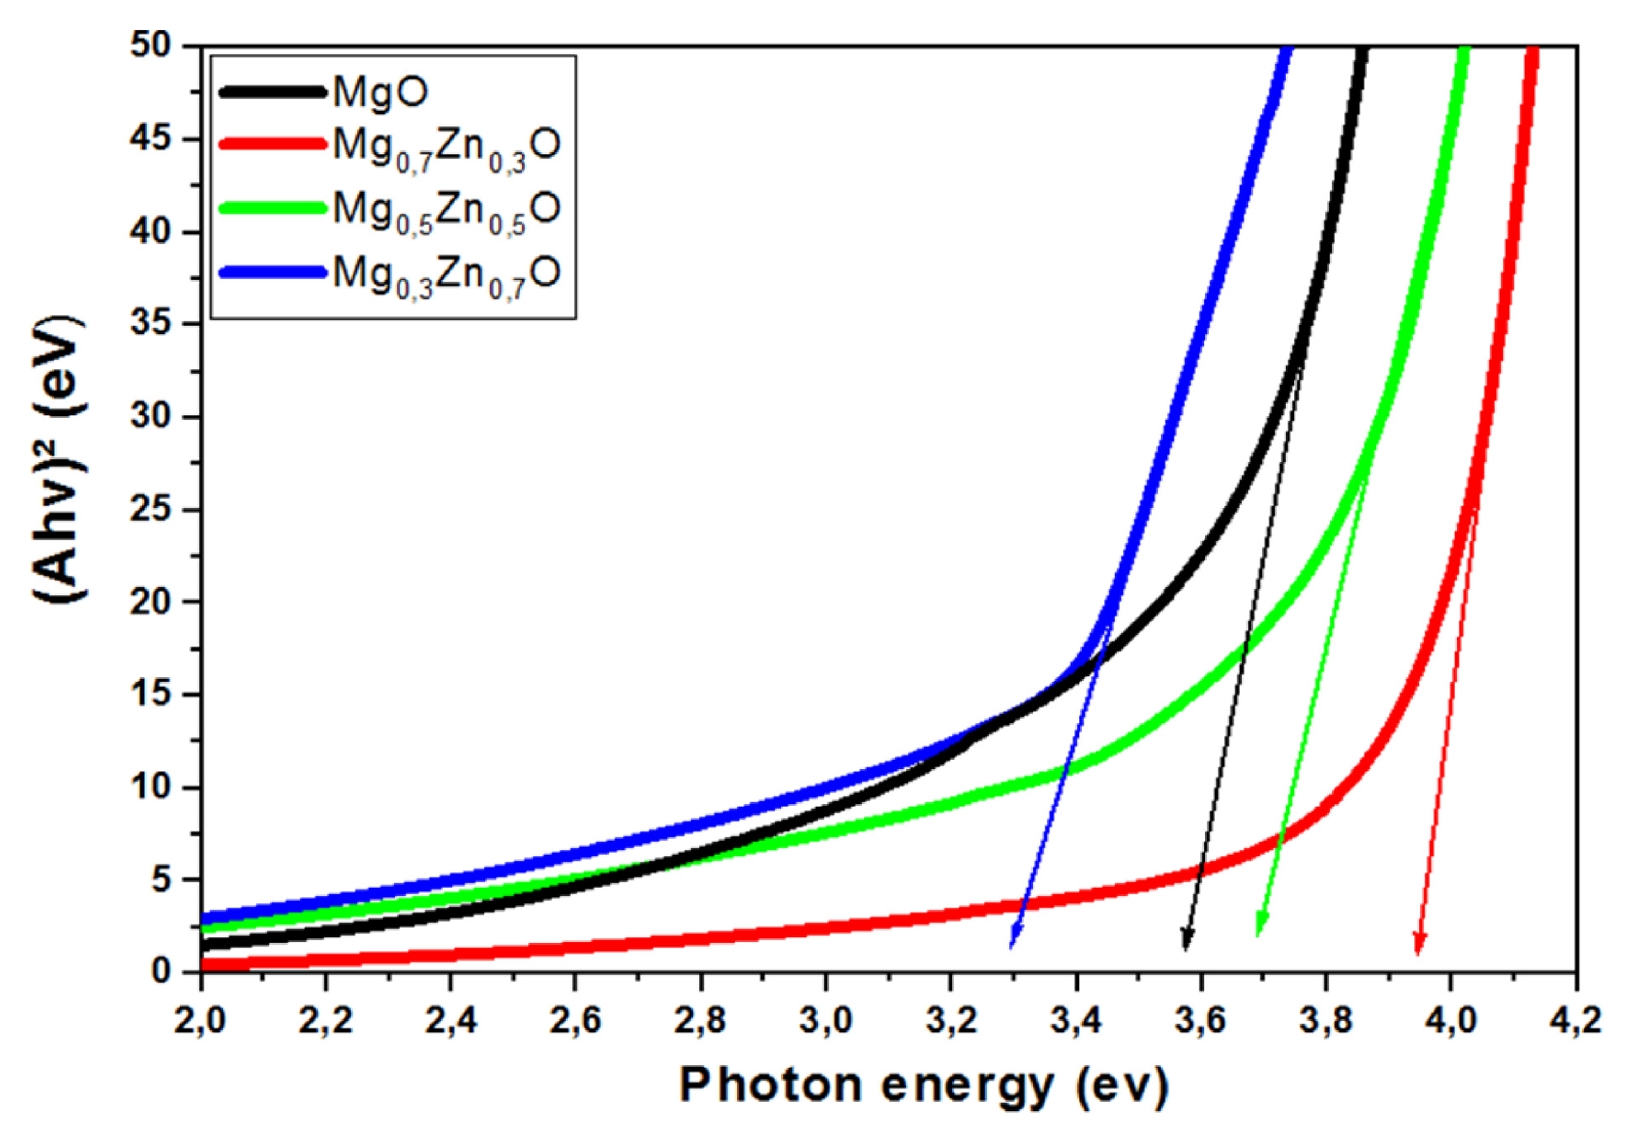
Eg is the band gap energy of the semiconductor. Accordingly, the optical band gap was determined using the Tauc relation by plotting (
Ahv)
2 versus (
hv) and extrapolating the linear region to (
Ahv)
2 = 0 [
29,
30], as clearly shown in
Fig. 6. On the other hand, the Urbach tail energy (
Eu), associated with structural disorder in the film network, can be determined from the exponential absorption edge and is expressed by
Eq. (7) [
31]:
where
α is the absorption coefficient,
α0 is a constant,
hv is the photo energy and
Eu is the Urbach energy.
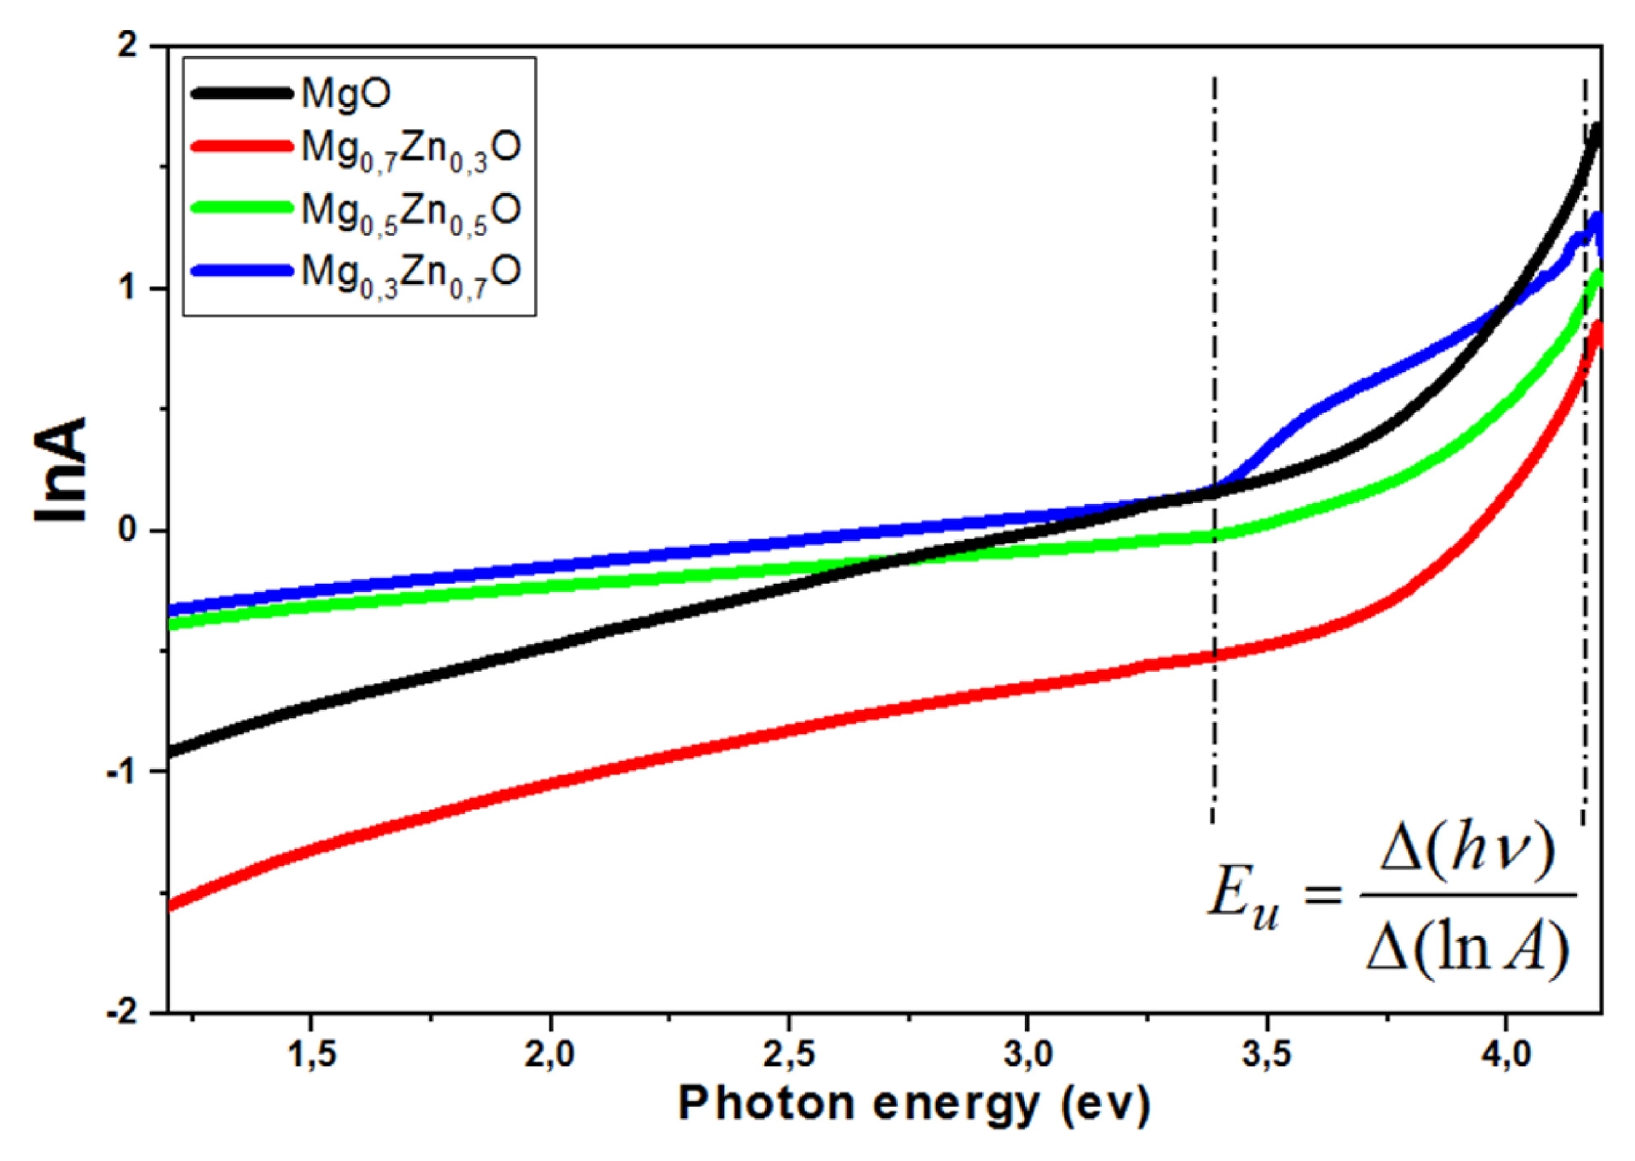
Fig. 7 shows the plot of ln
A as a function of photon energy (
hv) used to determine the Urbach energy from the slope of the linear region (
Eu=Δ(hv)Δ(lnA)).
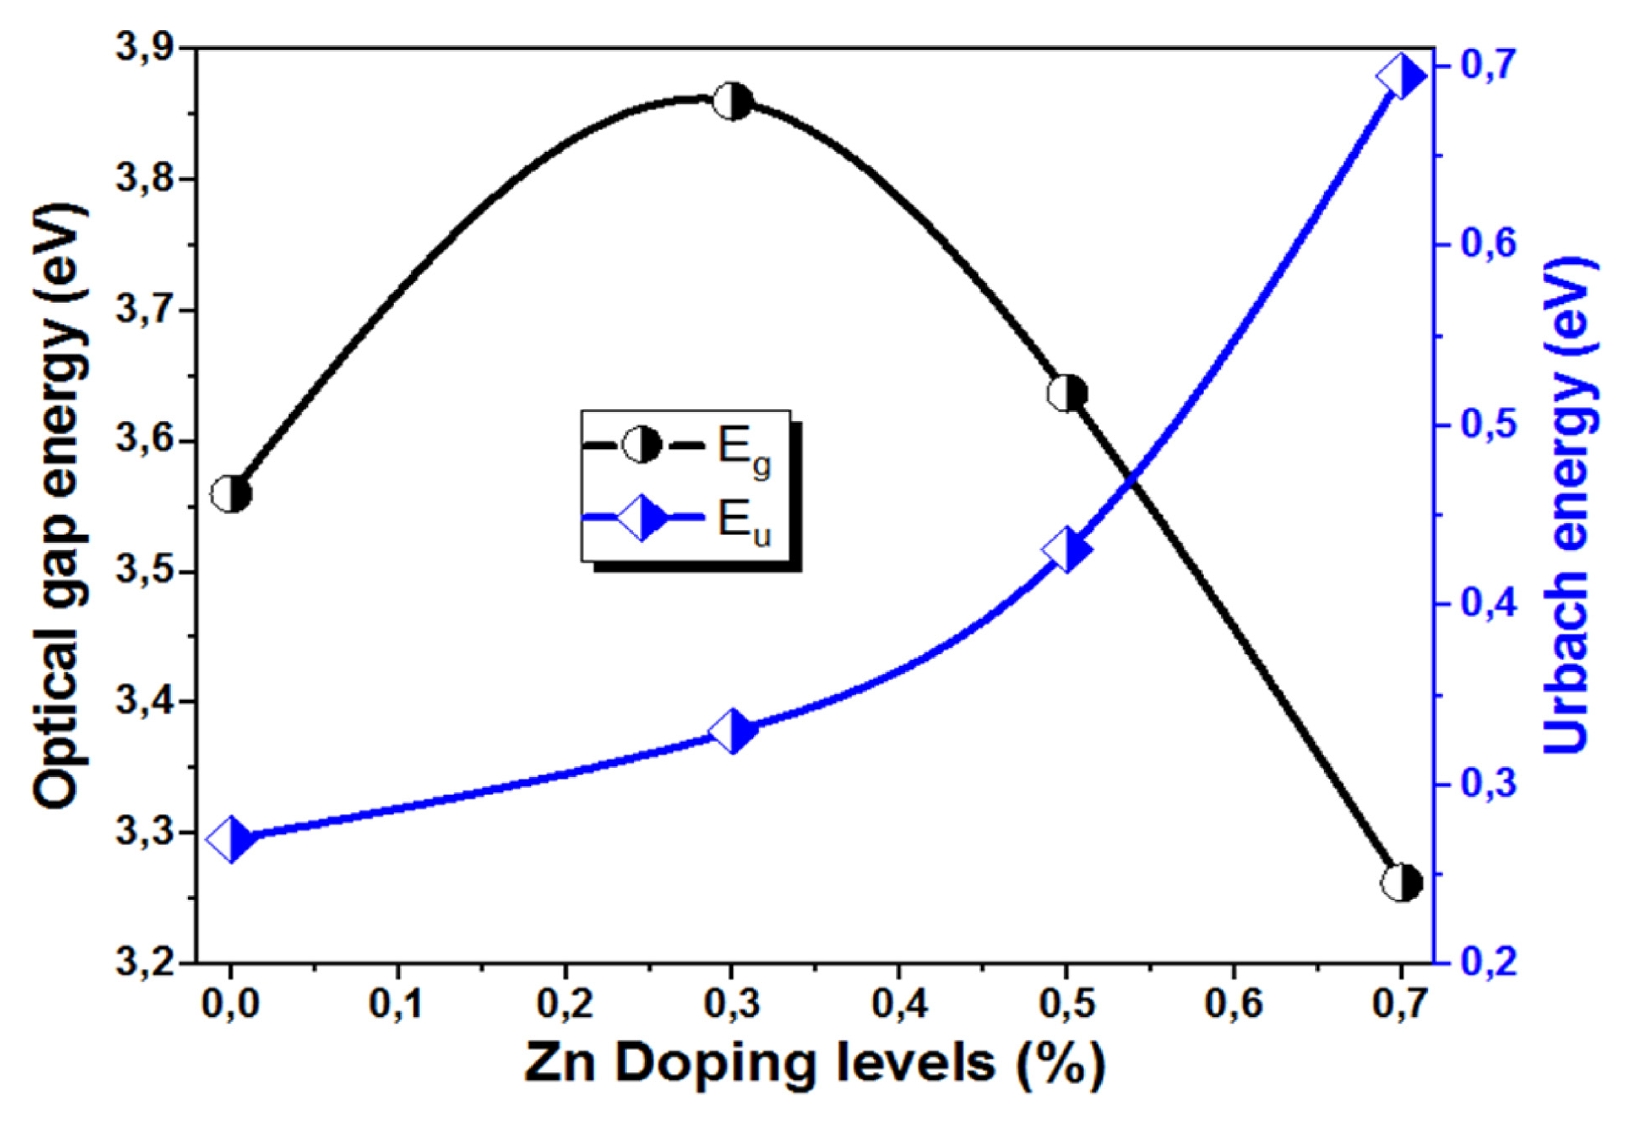
Fig. 8 shows the variation of the optical band gap energy (
Eg) and Urbach energy (
Eu) of Mg
1-xZn
xO thin films with different Zn concentrations (x = 0, 0.3, 0.5 and 0.7%). The optical band gap initially increases from 3.56 eV for udoped MgO thin film (x = 0) to a maximum value of 3.93 eV for the (Mg
0.7Zn
0.3O) thin film (x = 0.3). This increase may be attributed to the Burstein–Moss effect, whereby an increase in carrier concentration results in the occupation of the lower-energy states of the conduction band, leading to an apparent widening of the optical band gap. Beyond this concentration, the optical band gap gradually decreases to 3.26 eV for the (Mg
0.3Zn
0.7O) thin film (x = 0.7). This band gap narrowing can be attributed to the formation of localized defect states, lattice distortion, and increased structural disorder at higher Zn concentrations. This behavior is consistent with the Roth effect and has been reported by other researchers [
32]. Moreover, the hybridization between the Zn 3d orbitals and O 2p states can modify the electronic band structure, leading to a reduction in the band gap energy [
33]. On the other hand, the Urbach energy exhibits a continuous increase with Zn concentration, rising from 0.270 to 0.695 eV. This increase reflects the enhancement of structural disorder and defect density within the film network, resulting in a broader distribution of localized states near the band edges. The opposite trends observed for
Eg and
Eu confirm that increased structural disorder leads to band tailing and a narrowing of the optical band gap [
34]. These results suggest that moderate Zn incorporation improves the optical properties of Mg
1-xZn
xO thin films whereas excessive Zn doping deteriorates of the structural order and consequently degrades the optical performance [
35].
Table 3 summarizes the values of
Eg and
Eu for the different Zn concentrations (x = 0, 0.3, 0.5, and 0.7%) of Mg
1-xZn
xO thin films. The obtained results are in good agreement with those reported in the literature [
36].
3.4 Study FTIR Analysis of Mg1-xZnxO Thin Films
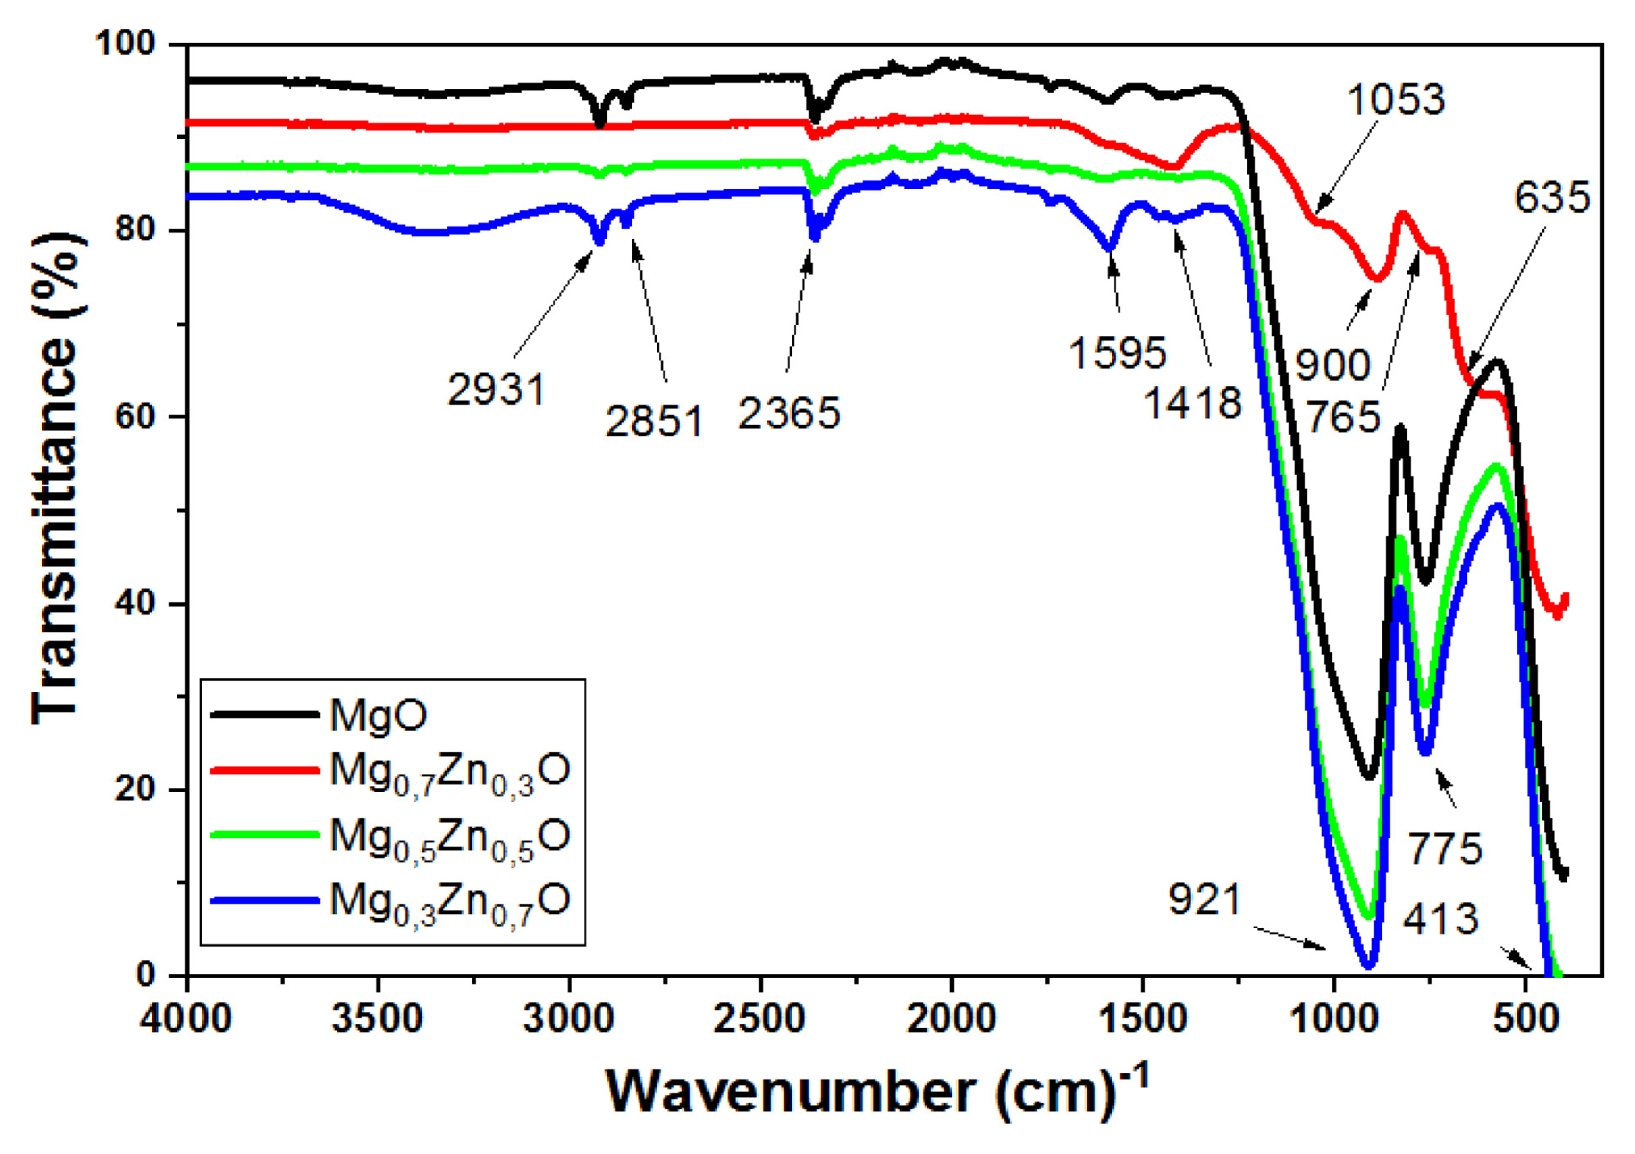
Fig. 9 presents the FTIR spectra of Mg
1-xZn
xO thin films deposited with different Zn concentrations (x = 0, 0.3, 0.5 and 0.7%). The spectra reveal several characteristic absorption bands corresponding to the vibrational modes of the Mg–O and Zn–O bonds, as well as surface-adsorbed species. The broad absorption observed in the low wavenumber region between 400 and 700 cm
-1 is attributed to the stretching vibrations of Mg–O and Zn–O bonds, confirming the formation of the oxide network in the films. The shift and variation in the intensity of the bands located at approximately 775 and 921 cm
−1, indicate the successful incorporation of Zn ions into the MgO lattice, leading to modifications in the crystal structure [
37]. The absorption band observed between 1,418 and 1,595 cm
-1 is attributed to the bending vibrations of hydroxyl groups (H–O–H) associated with adsorbed water molecules on the film surface. Furthermore, the absorption bands located around 2,851 and 2,931 cm
-1 are assigned to the stretching vibrations of C–H bonds, which may originate from residual organic species or precursor-related compounds [
38,
39]. The band near 2,365 cm
-1 is attributed to the absorption of atmospheric CO
2. In addition, the bands detected near 1053, 921, 900, 775, 765, 635, and 413 cm
-1 are associated with Zn–O and Mg–O vibrational modes, as well as lattice deformation vibrations [
40,
41]. These observations are consistent with the structural and optical analyses, confirming that Zn incorporation significantly influences the chemical bonding and network structure of Mg
1-xZn
xO thin films.
3.5 Study Electrical Properties of Mg1-xZnxO Thin Films
The sheet resistance
Rsh of Mg
1-xZn
xO was determined using the four-point probe technique, this technique provides a reliable measurement of the electrical properties of thin films and allows the sheet resistance to be calculated using the
Eq. (8) [
30]:
where I is the applied currant I = 1 nA and V is the measured voltage. The measurements were performed using a highly sensitive four-point probe system capable of accurately detecting currents in the range (pA–nA). Instruments such as high-precision source measure units (SMUs) and picoammeters can provide reliable measurements at such low current levels.
The sheet resistance values calculated from the measured current and voltage data are summarized in
Table 4.
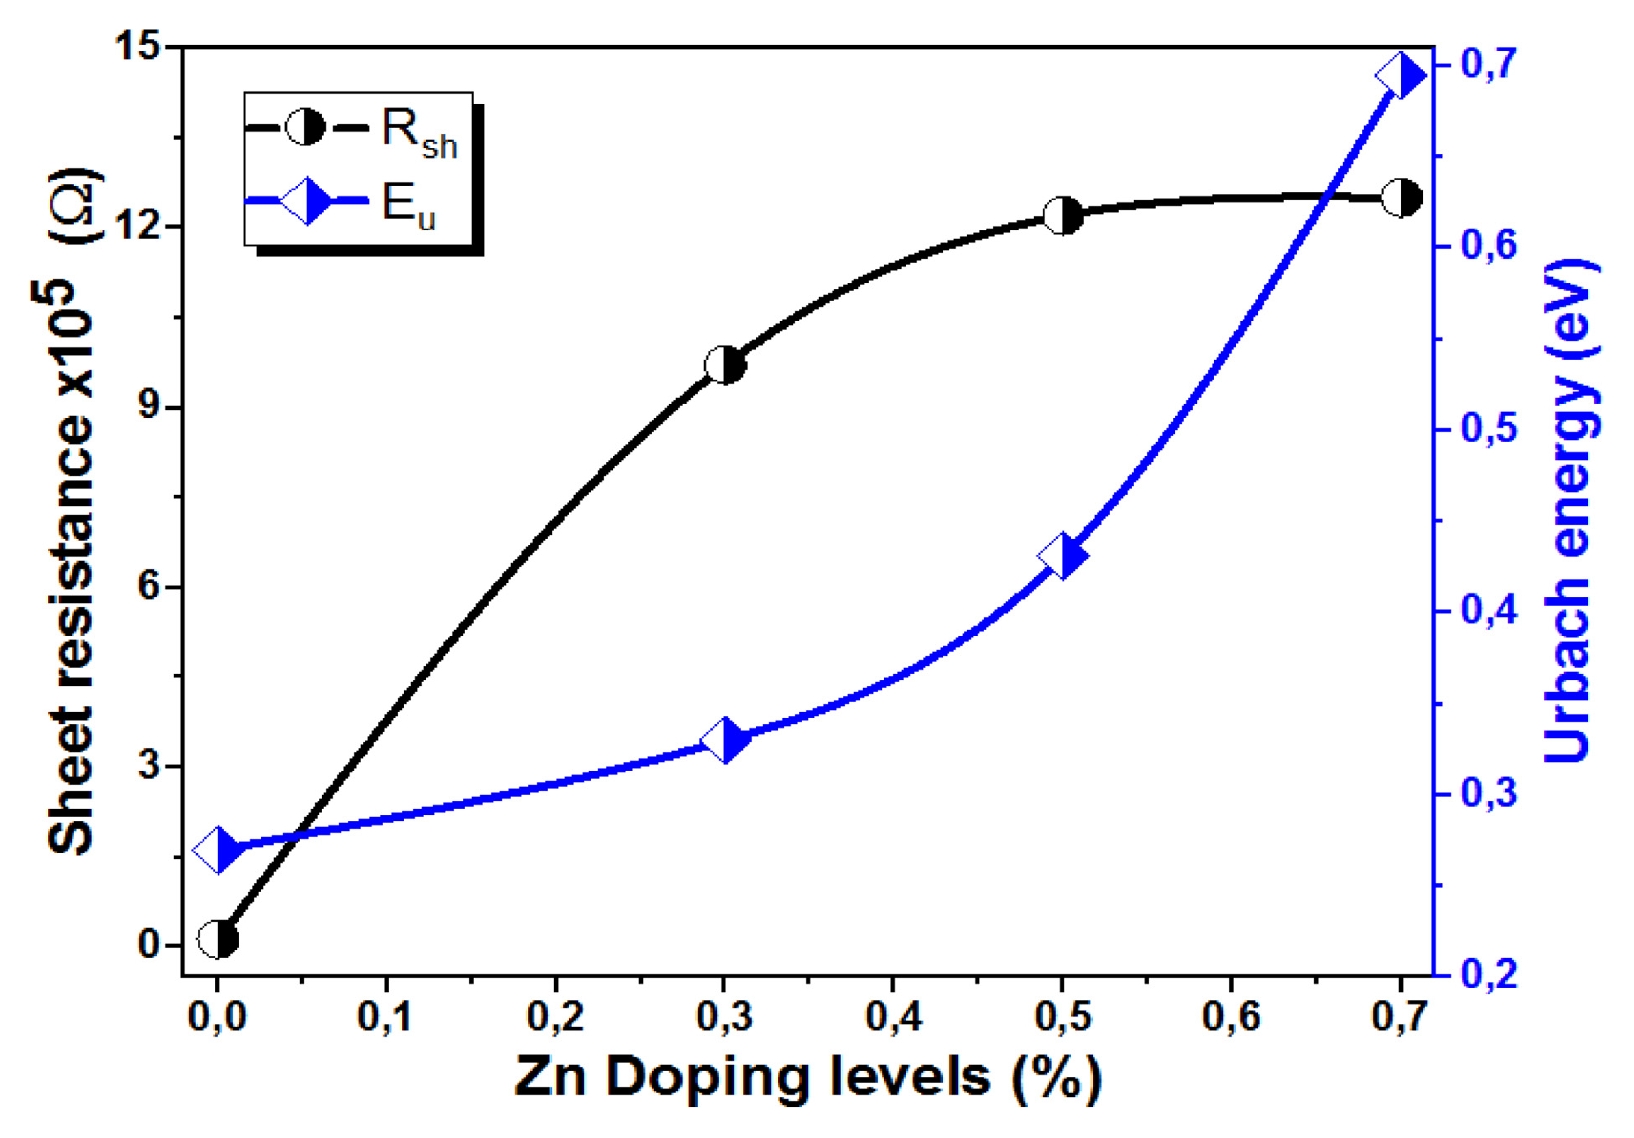
Fig. 10 shows the variation of sheet resistance (
Rsh) and Urbach energy (
Eu) of Mg
1-xZn
xO thin films as a function of Zn concentration (x = 0, 0.3, 0.5 and 0.7%). The sheet resistance increases significantly with Zn doping, reaching its highest value of 1.25 × 10
6 (Ω) for the (Mg
0.3Zn
0.7O) thin film (x = 0.7). The increase becomes more pronounced at higher Zn doping concentrations and may be attributed to oxygen chemisorptions at grain boundaries, which can trap charge carriers and reduce their mobility [
37,
41]. Furthermore, Zn incorporation into the MgO lattice may introduce additional defects and scattering centers, leading to enhanced carrier scattering and a consequent increase in electrical resistance [
35,
40]. In parallel, the Urbach energy increases with increasing Zn content, indicating a higher degree of structural disorder a greater density of localized states within the band-gap region. The increase in the Urbach energy reflects the growing concentration of lattice imperfections and defects induced by Zn incorporation. Although, Zn doping promotes crystallite growth, as evidenced by the increase in crystallite size (see
Fig. 2), the associated rise in defect density and structural disorder adversely affects the electrical transport properties of the films. The simultaneous increase in
Rsh and
Eu suggests a strong correlation between electrical resistance and structural disorder, confirming that Zn doping significantly influences both the electrical and optical properties of MgO thin films.
Table 5 highlights the strong dependence of structural, optical, and electrical properties of Mg
1-xZn
xO thin films on Zn concentration. A comparison with previously reported studies demonstrates that the structural, optical, and electrical properties of Mg–Zn–O thin films are significantly influenced by both the deposition technique and the Zn concentration. Compared with the pulsed laser deposition results reported by Hasan [
42], the Mg
1-xZn
xO thin films prepared in the present work using the spray pneumatic technique exhibit smaller crystallite sizes, ranging from 8.12 to 12.49 nm, indicating the formation of finer nanocrystalline microstructures. The obtained optical band gap values obtained in this study, ranging from 3.26–3.93 eV, are comparable to those reported for aerosol deposited Zn
1-xMg
xO
2 films by Morari et al. [
43], confirming the tunable properties through compositional modification. In addition, the electrical measurements reveal sheet resistance values on the order of 10
5–10
6 Ω, indicating that Zn incorporation has a significant influence on the electrical transport properties of the films. These results demonstrate that spray pneumatic deposition is an effective, simple, and low-cost technique for producing Zn
1-xMg
xO
2 thin films with tunable structural, optical, and electrical characteristics suitable for potential optoelectronic applications.
4. Conclusions
In conclusion, the Mg1-xZnxO thin films were successfully deposited on glass substrate by spray pneumatic method at 450oC. The Mg1-xZnxO thin films were prepared from a 0.15 M precursor solution containing Magnesium acetate [Mg(CH3COO)2, 4H2O] and Zinc acetate dehydrate [Zn(CH3COO)2, 2H2O]. The influence of Zn concentration (x = 0.3, 0.5, and 0.7%) on the structural, morphological, optical and electrical of Mg1-xZnxO thin films was investigated. X-ray diffraction analysis revealed that all films exhibited a cubic MgO structure with characteristic diffraction peaks corresponding to the (111), (200), and (220) planes. The crystallite size increased gradually from 8.12 nm for undoped MgO film to 12.49 nm for x = 0.7 % Zn. The SEM observations showed that the Zn doping strongly influences the surface morphology of thin films. Moderate zinc concentrations improved film uniformity and cohesion, whereas excessive Zn content resulted in agglomeration and increased surface roughness. The optical measurements demonstrated high transparency in the visible region for all deposited films. The optical band gap increased from 3.56 eV for x = 0 (MgO) thin film to a maximum value of 3.93 eV at x = 0.3 (Mg0.7Zn0.3O) thin film, then decreased to 3.26 eV at higher Zn concentrations. In contrast, the Urbach energy increased continuously with Zn content, reaching a maximum value of 0.695 eV for x = 0.7, indicating an increase in structural disorder and localized states. The FTIR spectra of Mg1-xZnxO thin films demonstrate that the Zn incorporation significantly influences the chemical bonding and network structure of magnesium oxide thin films. The sheet resistance increases significantly with Zn doping, reaching its highest value of 1.25 × 10⁶ (Ω) at x = 0.7 (Mg0.3Zn0.7O) thin film. The correlated increase of both Rsh and Eu suggests that Zn doping strongly influences the electrical and optical disorder properties of MgO thin films.
Fig. 1The XDR patterns Mg
1-xZn
xO thin film deposited with
Fig. 5 The absorbance variation with the wavelength of Mg
1-xZn
xO thin films as a function of Zn concentration (x = 0, 0.3, 0.5 and 0.7%). The diffraction peaks corresponding to ZnO and MgO phases are indicated
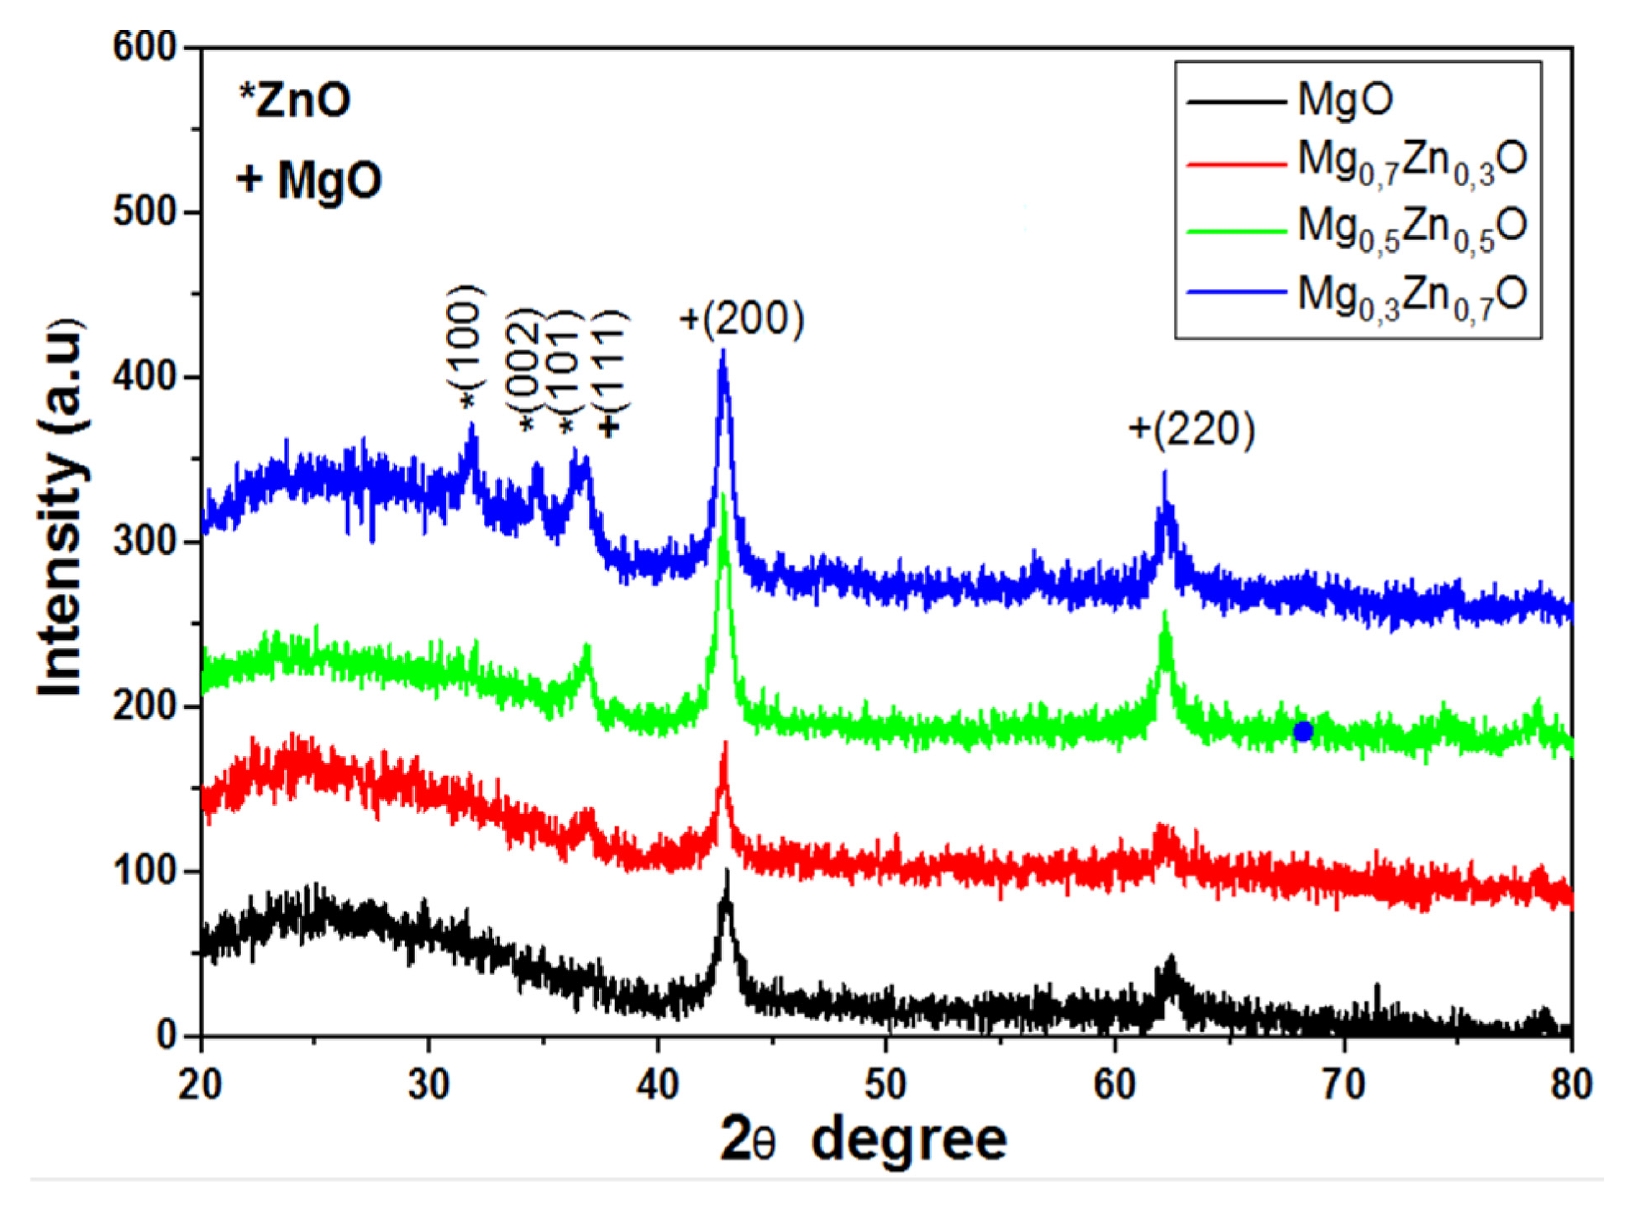
Fig. 2Variation of crystallite size, microstrain and dislocation density of Mg1-xZnxO thin film deposited with different Zn concentrations (x = 0, 0.3, 0.5 and 0.7%)
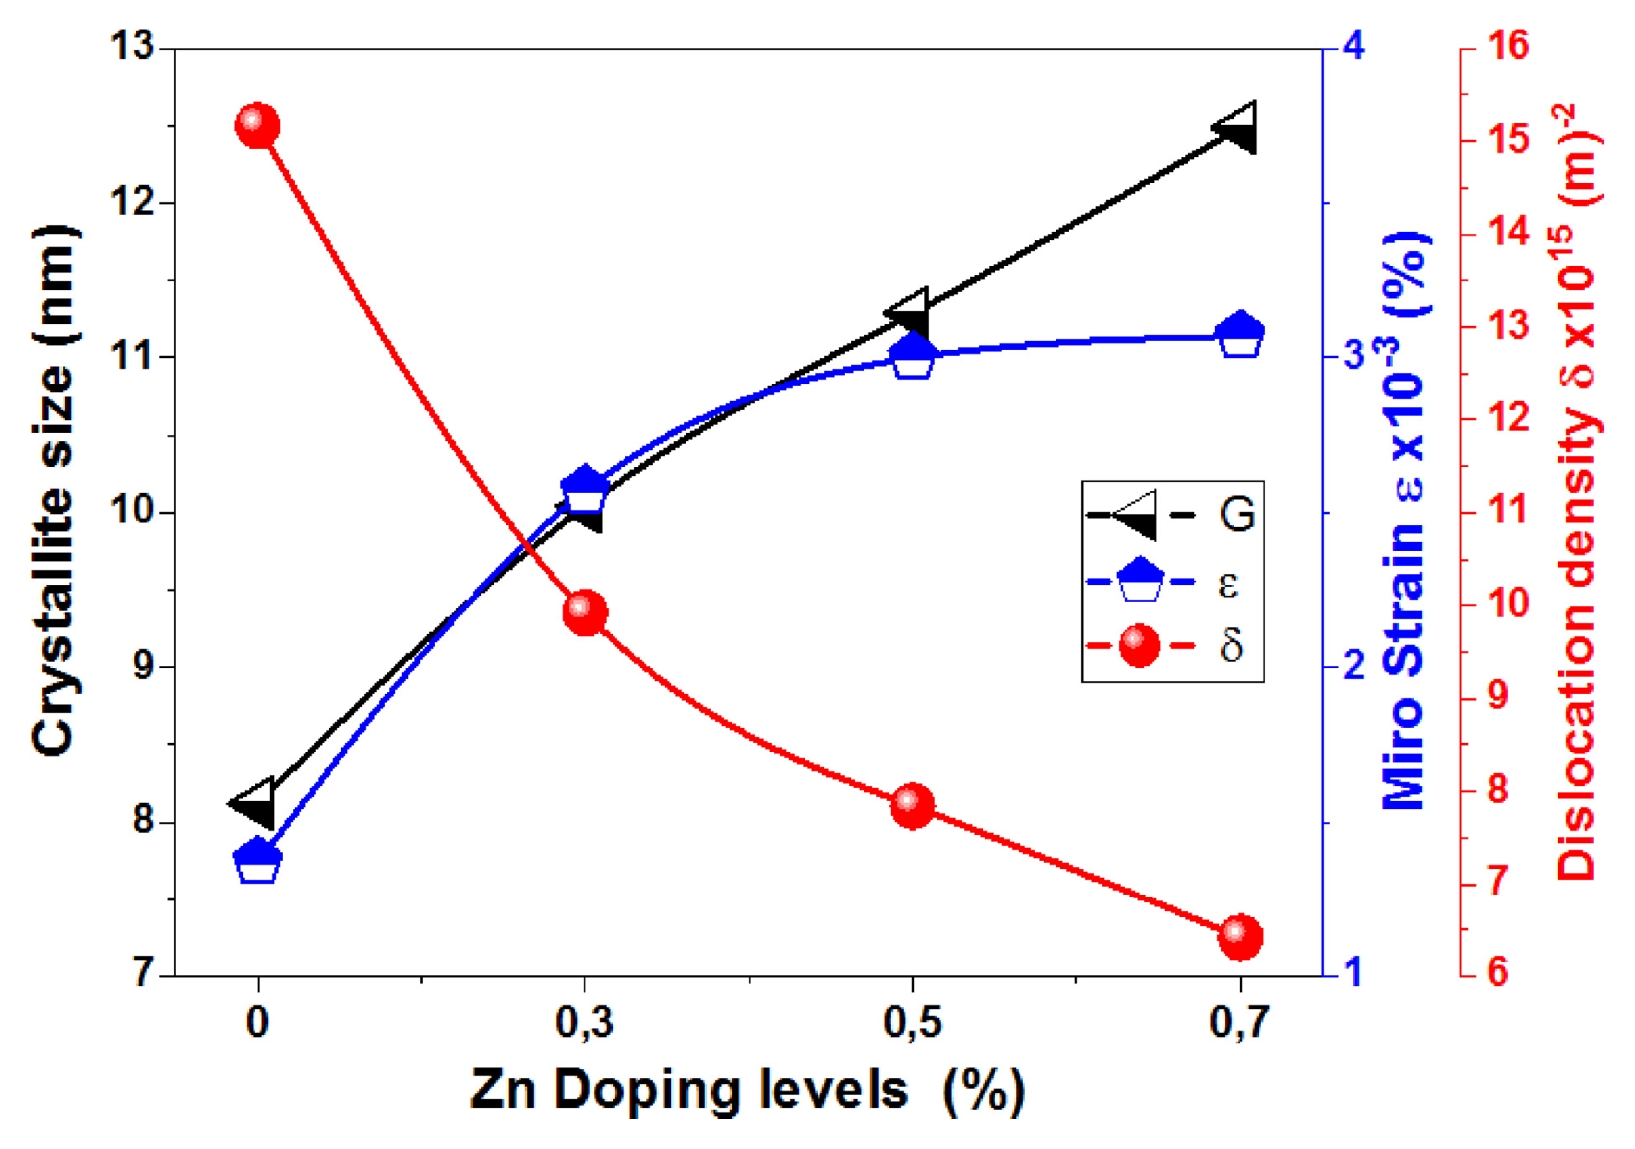
Fig. 3Surface morphology of Mg1-xZnxO thin film deposited with different Zn concentrations: (a) x = 0, (b) x = 0.3, (c) x = 0.5 and (d) x = 0.7
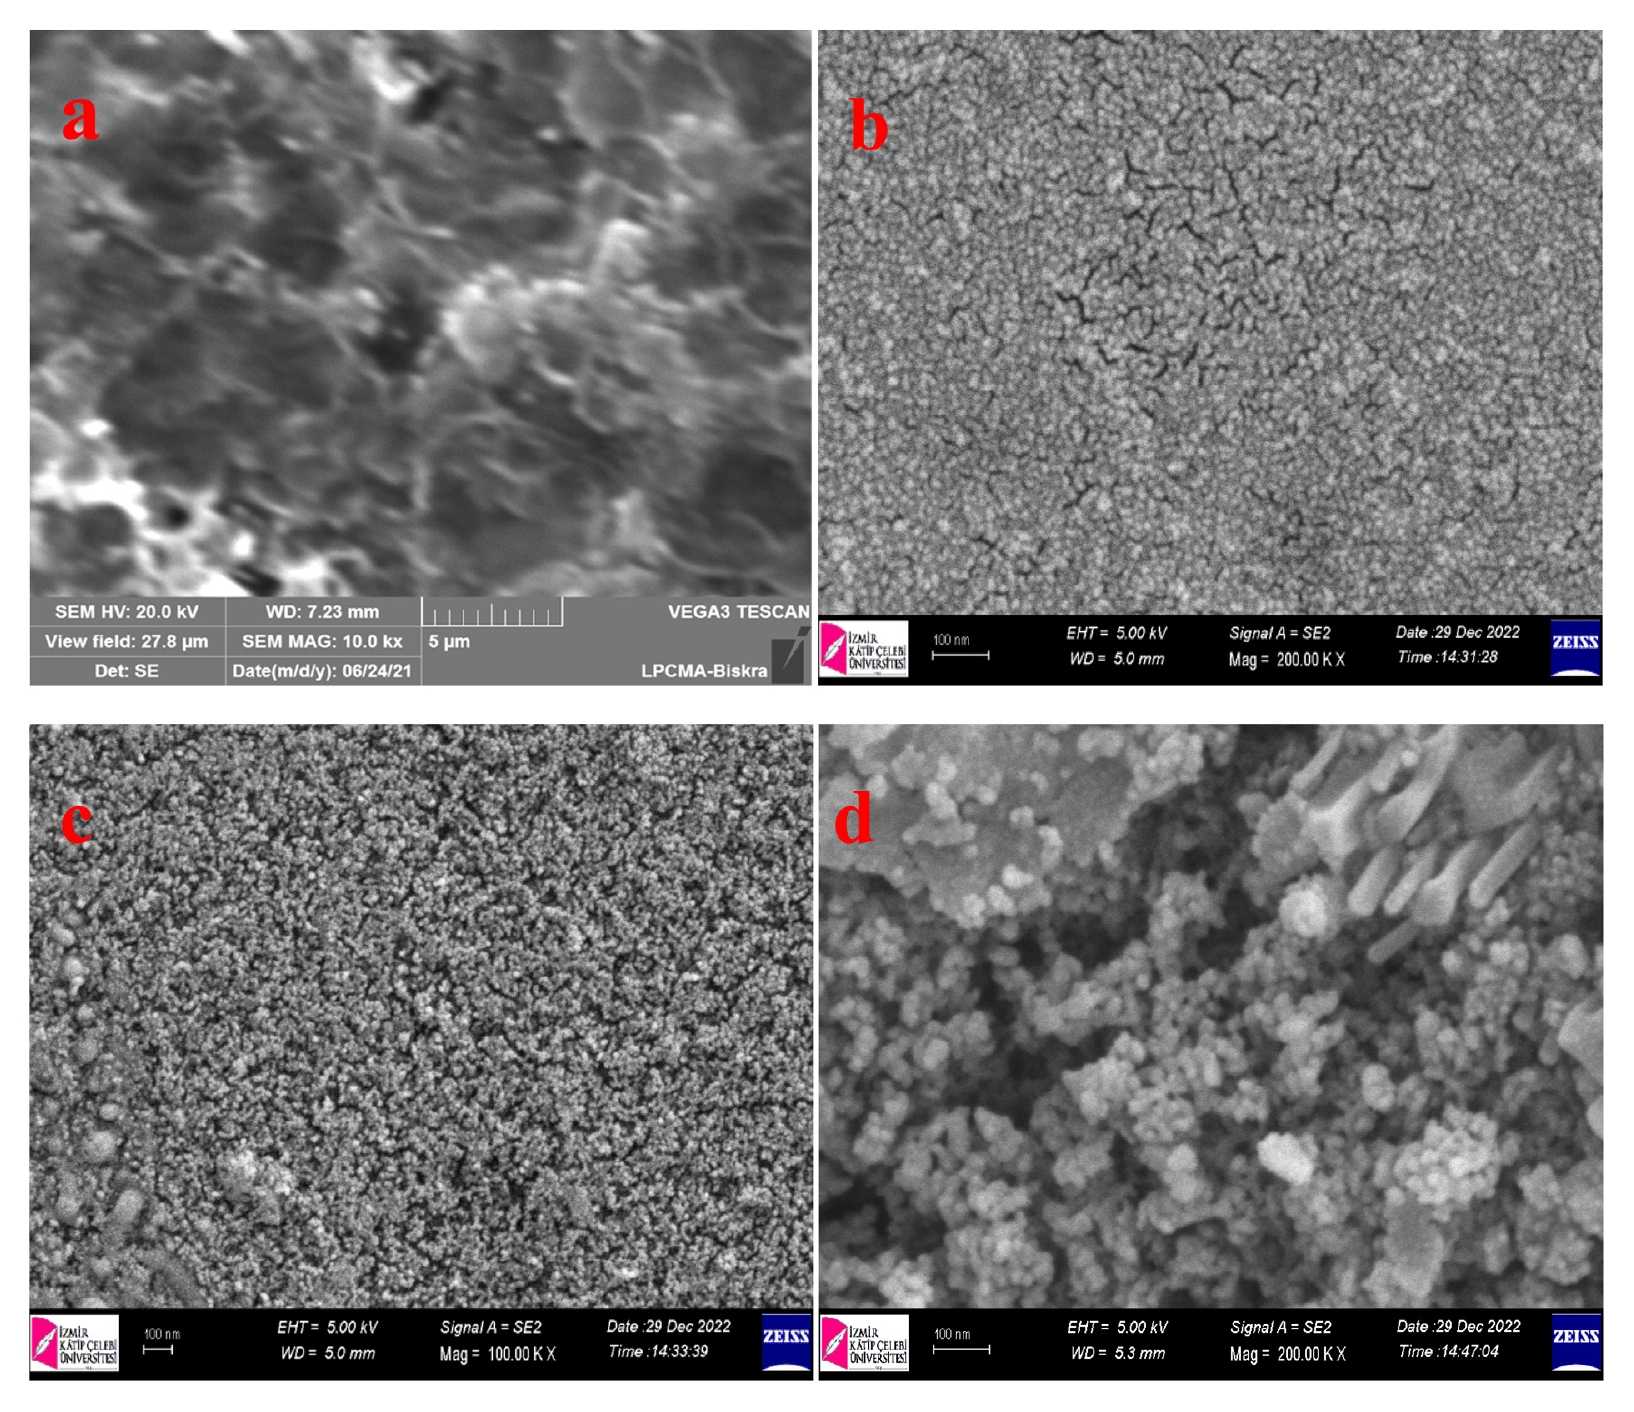
Fig. 4The transmittance spactra of Mg1-xZnxO thin films with various Zn concentrations (x = 0, 0.3, 0.5 and 0.7%)
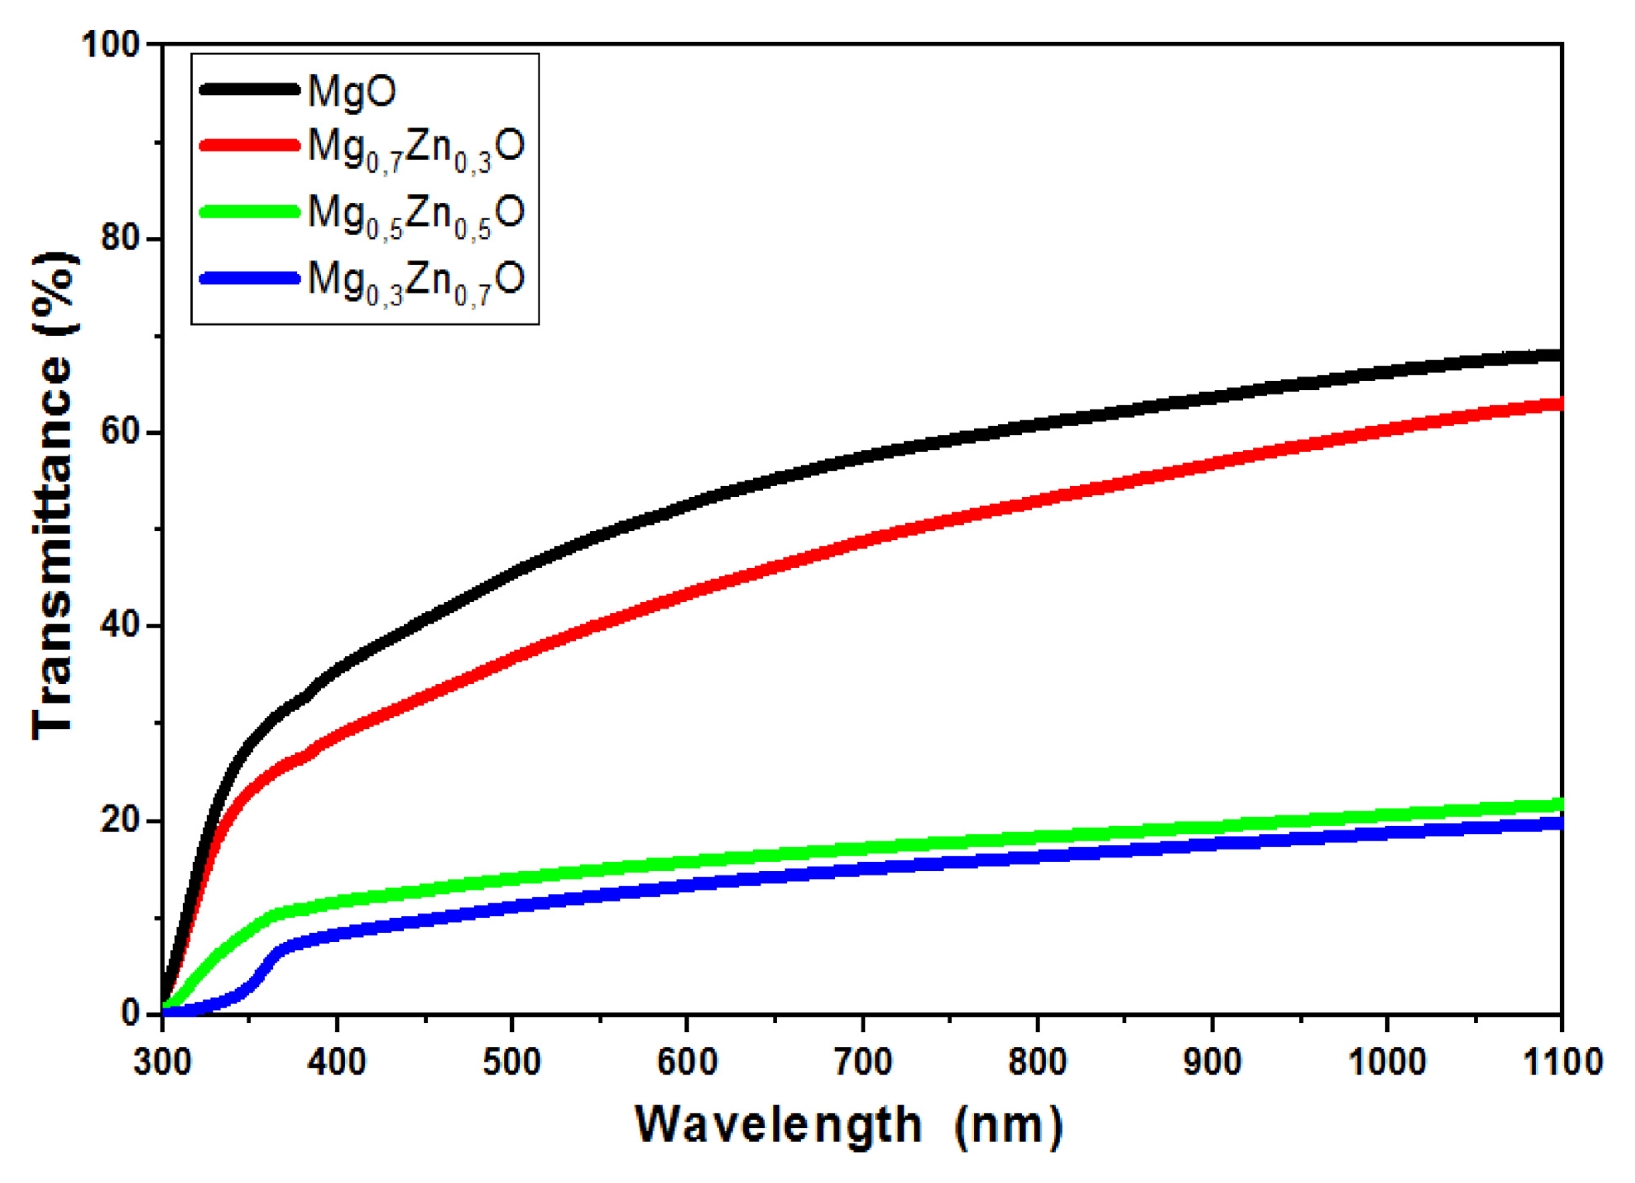
Fig. 5The absorbance variation with the wavelength of Mg1-xZnxO thin films as a function of Zn concentration (x = 0, 0.3, 0.5 and 0.7%)
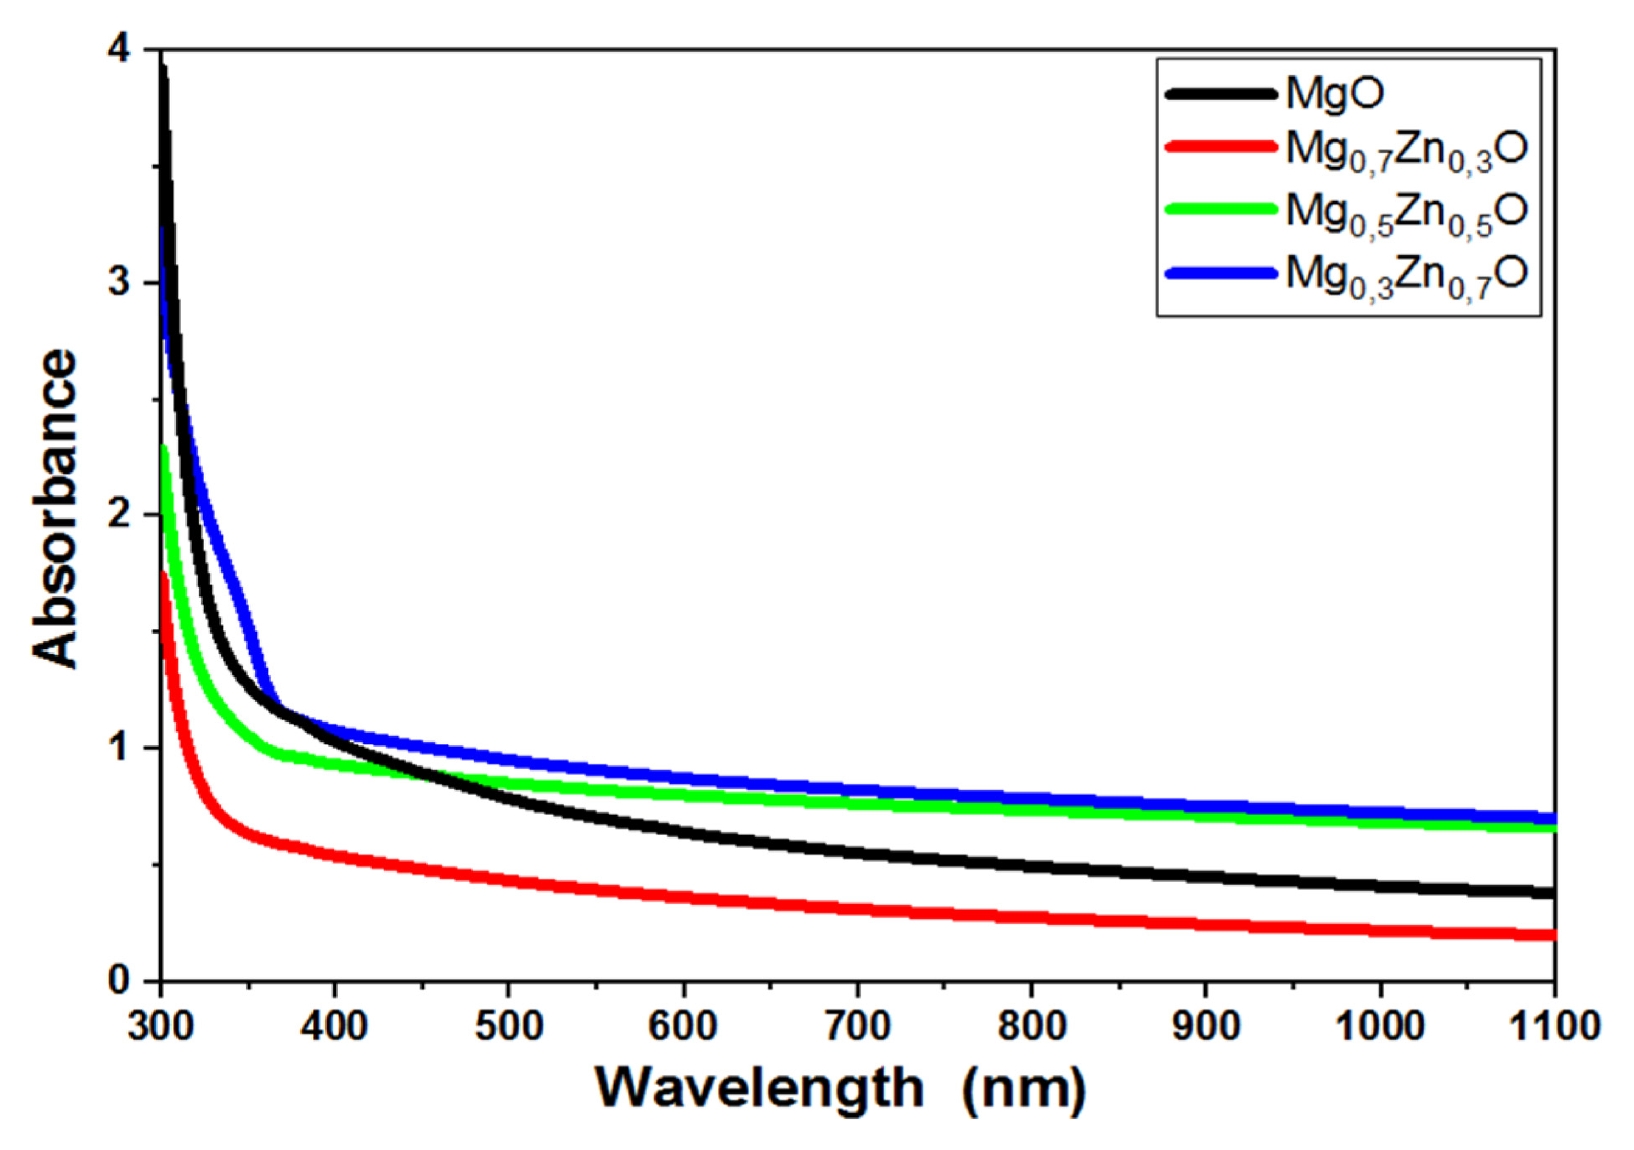
Fig. 6Plot of (Ahv)2 versus (hv) of Mg1-xZnxO thin films as a function of Zn concentration (x = 0, 0.3, 0.5 and 0.7%) for extrapolation of optical band gap energy Eg
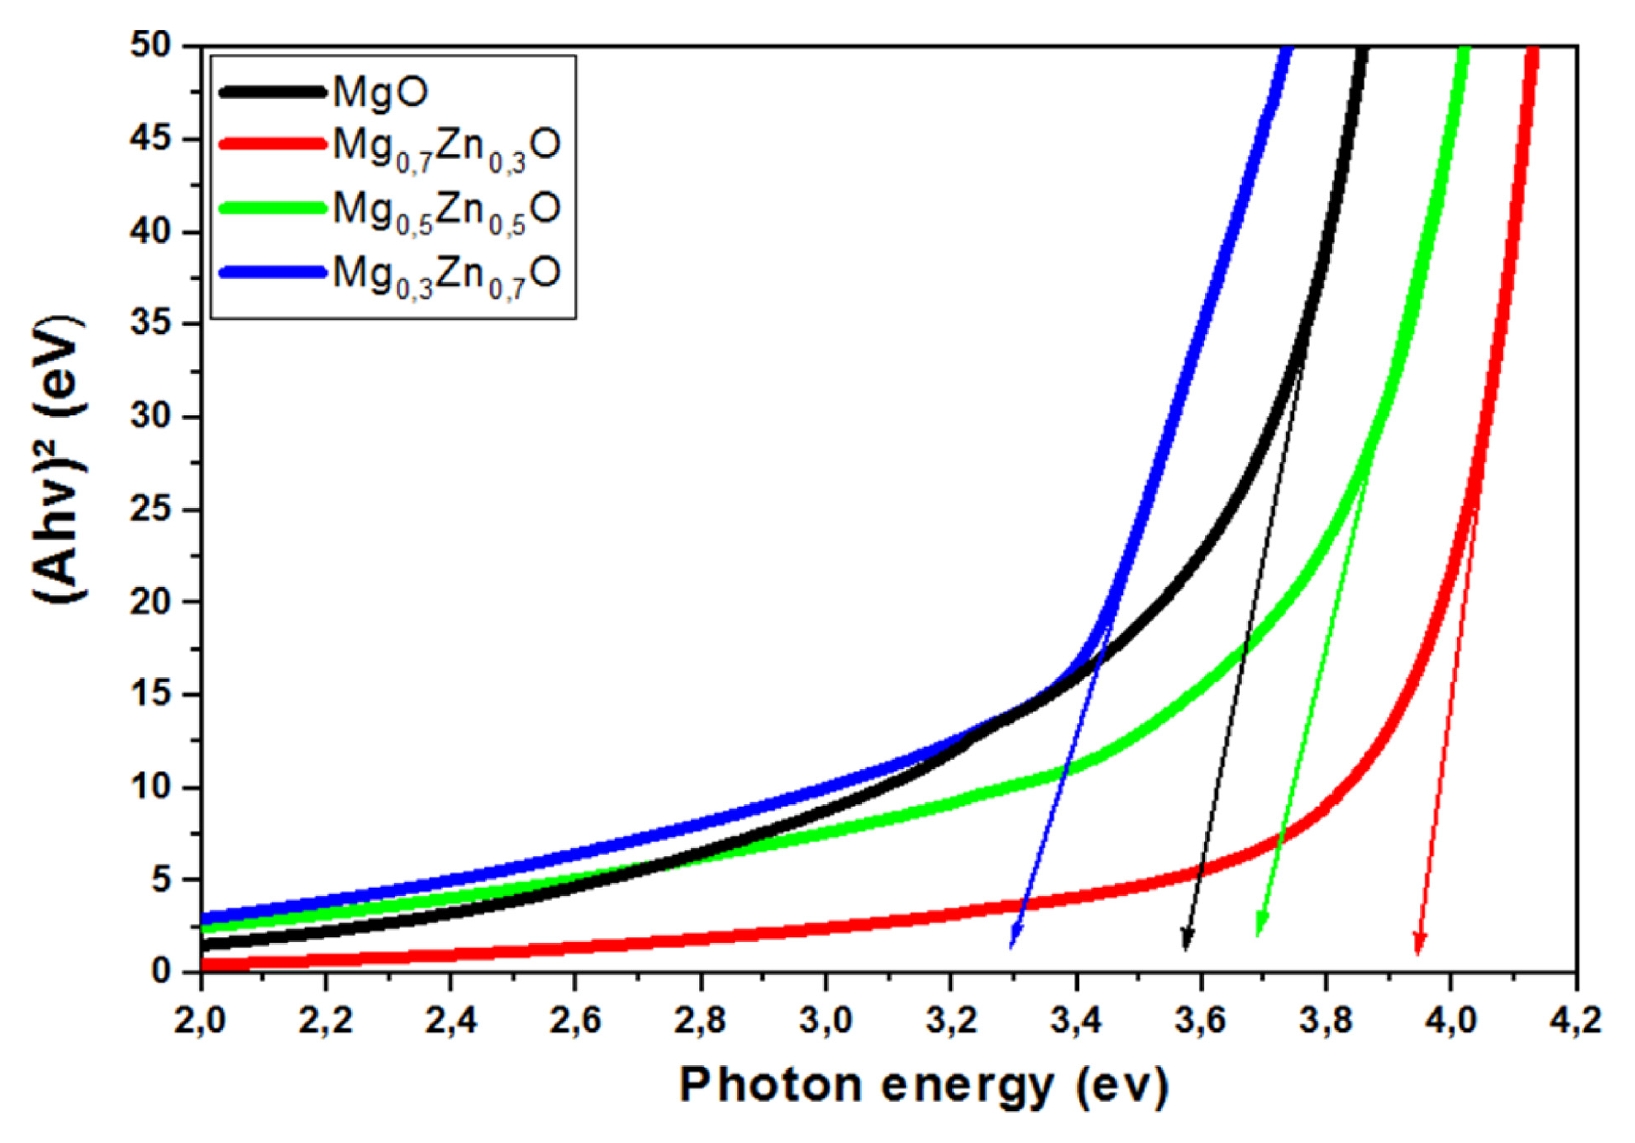
Fig. 7Plot of ln A versus (hv) of Mg1-xZnxO thin films as a function of Zn concentration (x = 0, 0.3, 0.5 and 0.7%) for deduce Urbach tail energy Eu
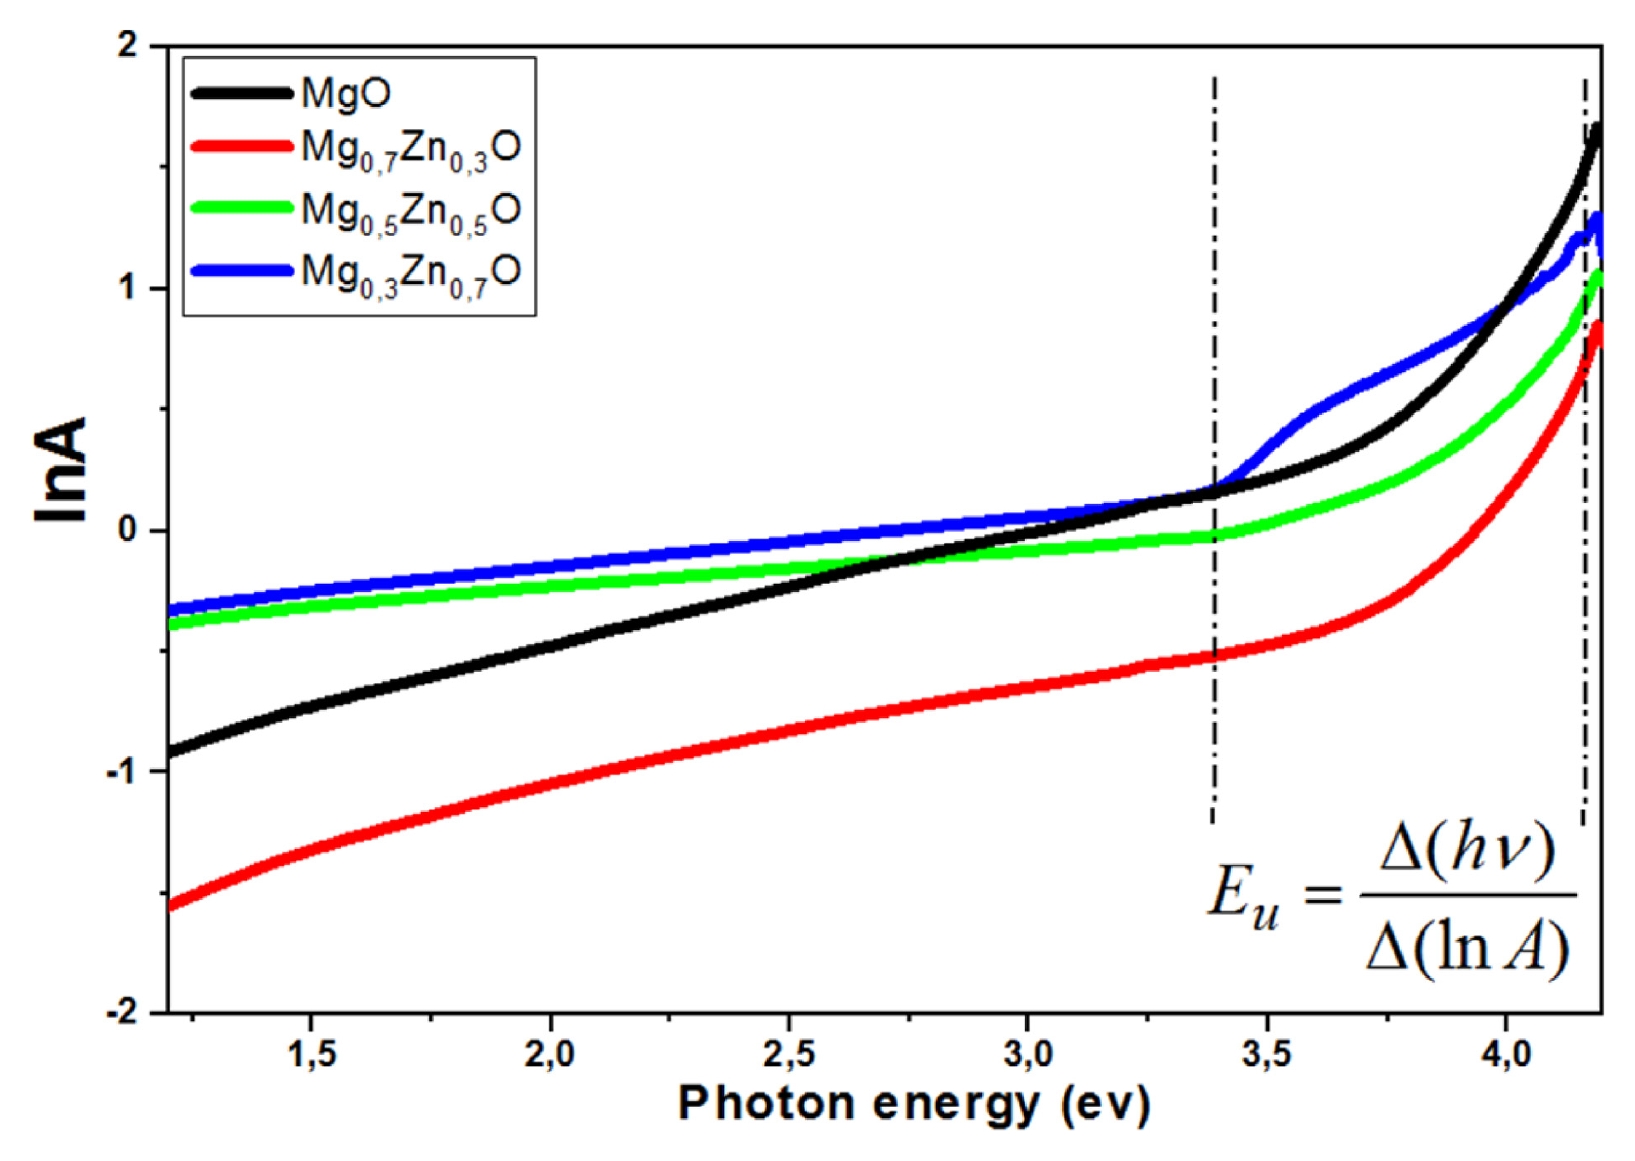
Fig. 8Variations of the optical band gap energy Eg and the Urbach energy Eu of Mg1-xZnxO thin films as a function of Zn concentration (x = 0, 0.3, 0.5 and 0.7%)
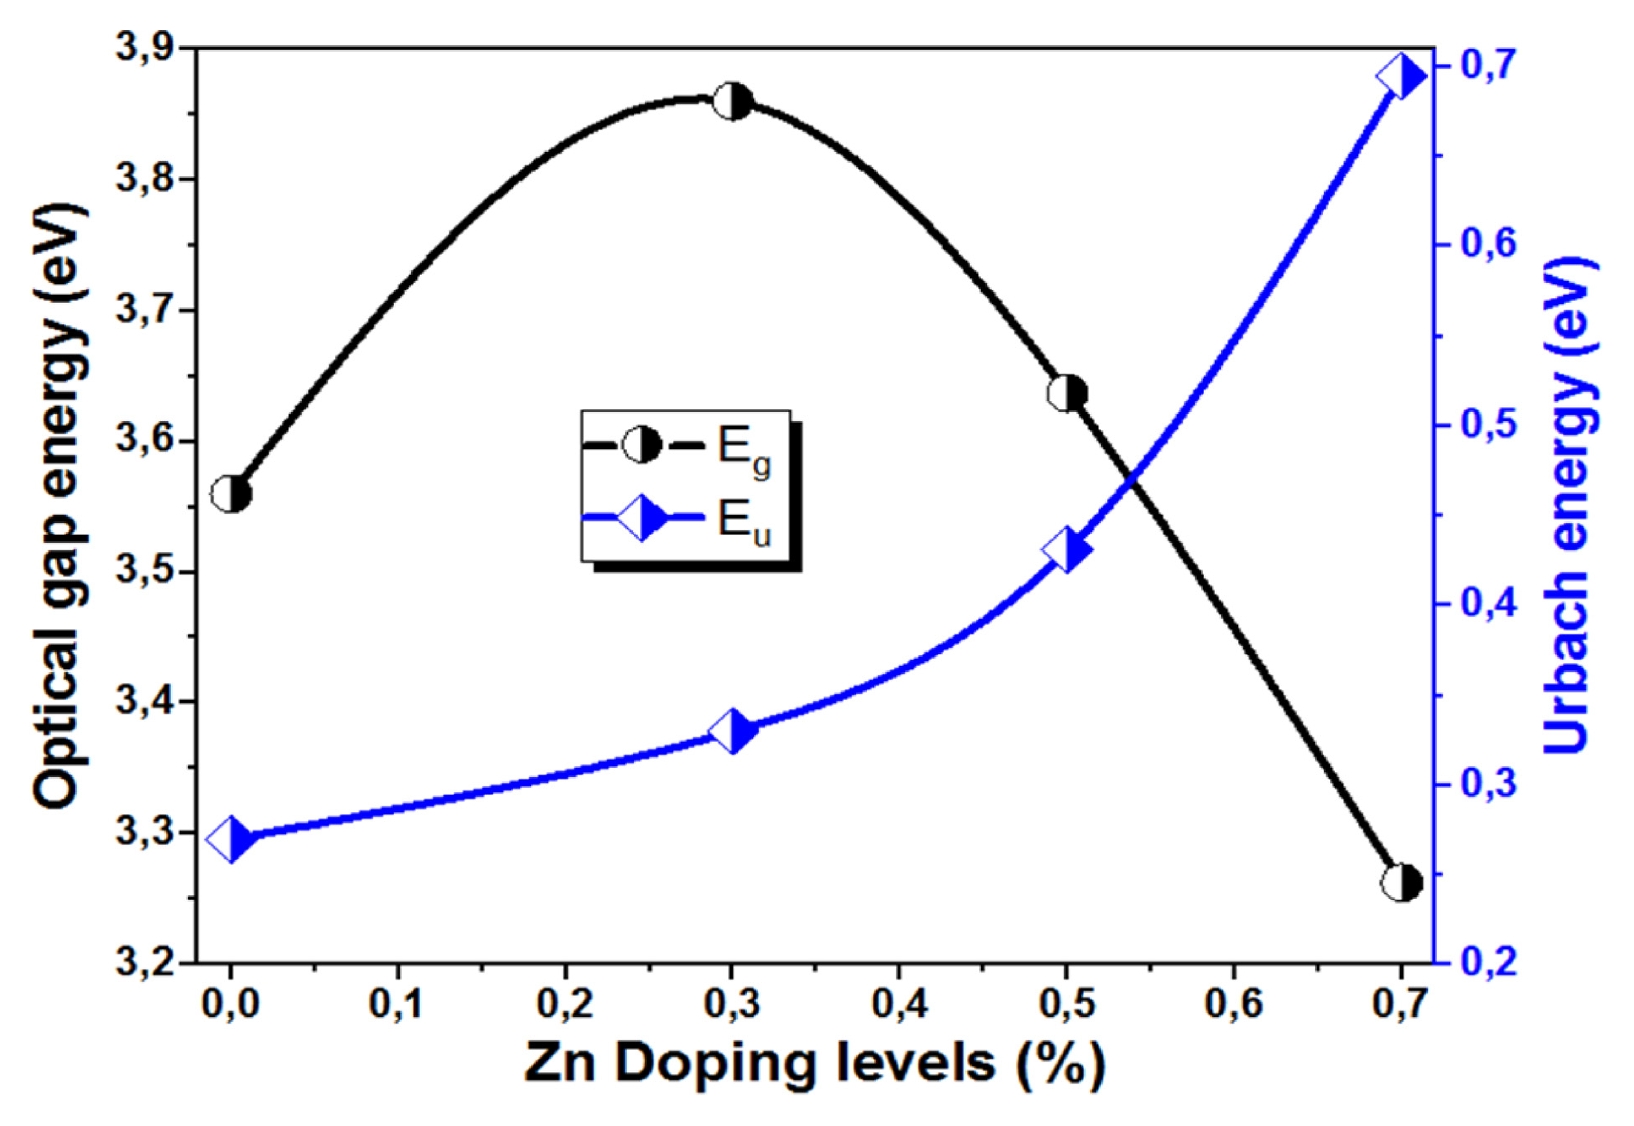
Fig. 9Typical FTIR spectra of synthesized of Mg1-xZnxO thin films as a function of Zn concentration (x = 0, 0.3, 0.5 and 0.7%)
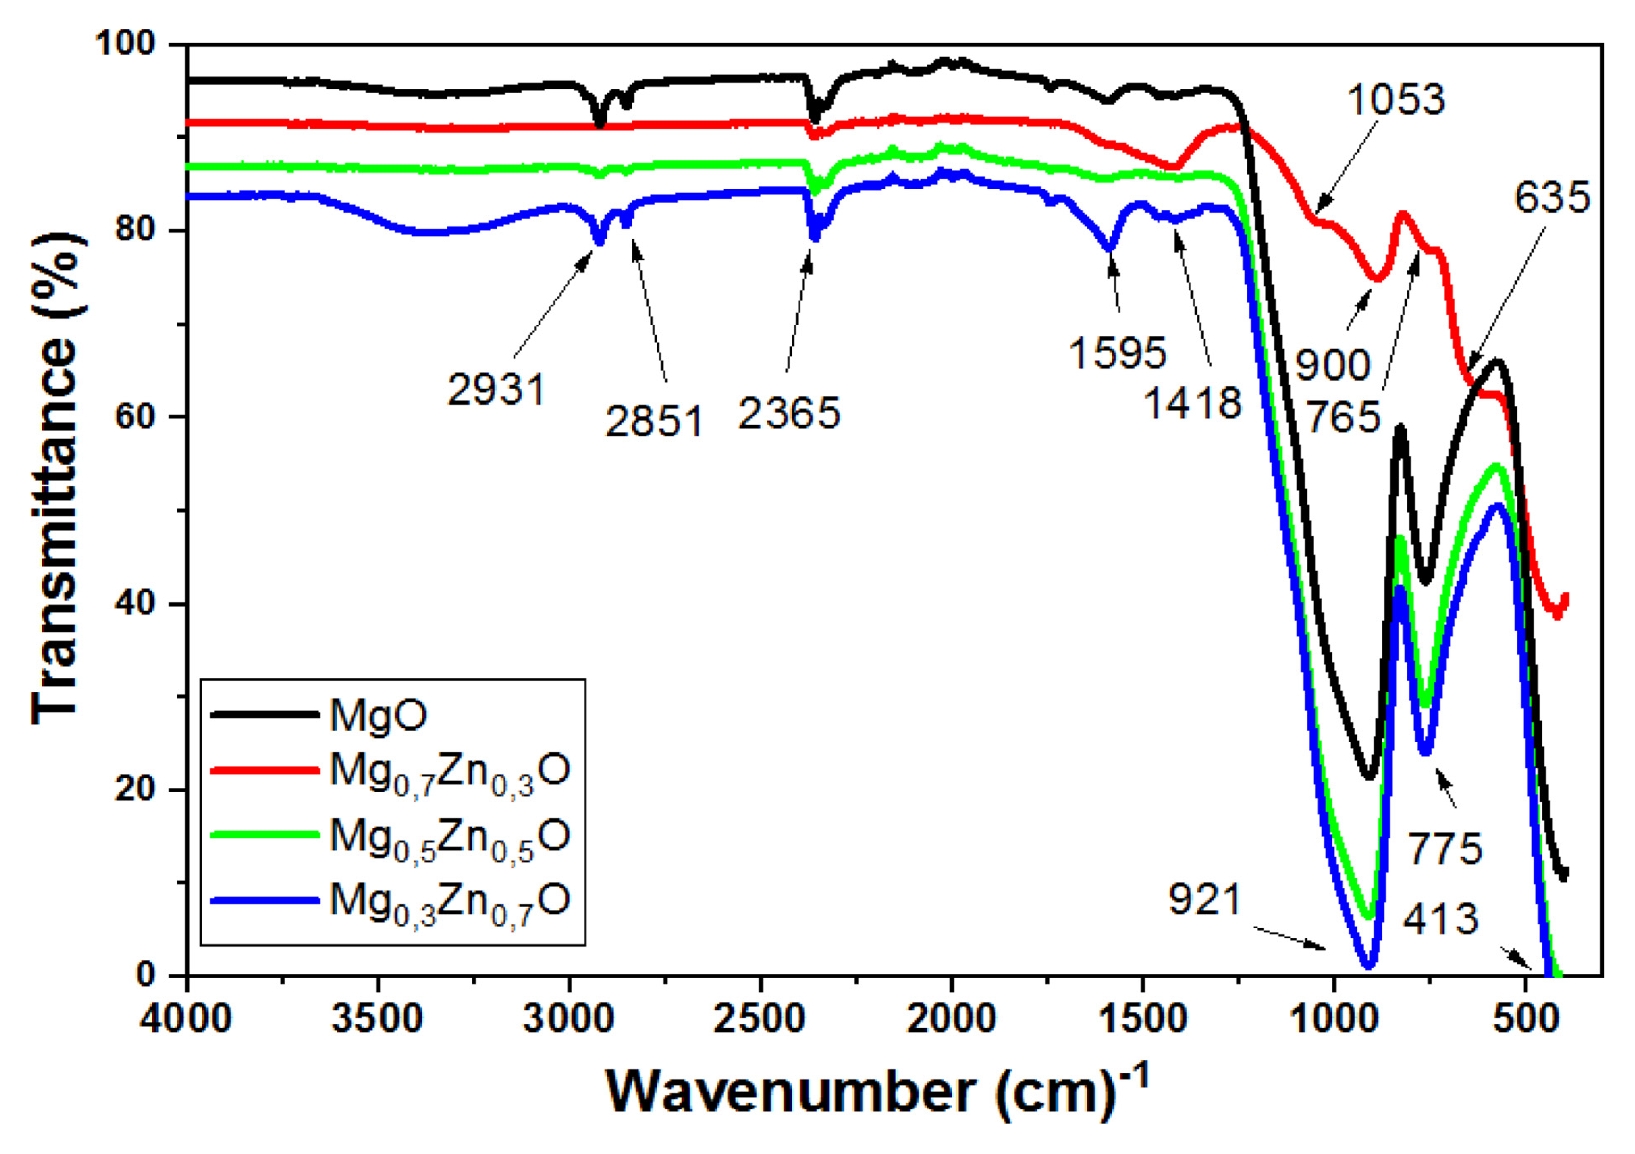
Fig. 10Variation of the sheet resistance and Urbach energy of Mg1- xZnxO thin films as a function of Zn concentration (x = 0, 0.3, 0.5 and 0.7%)
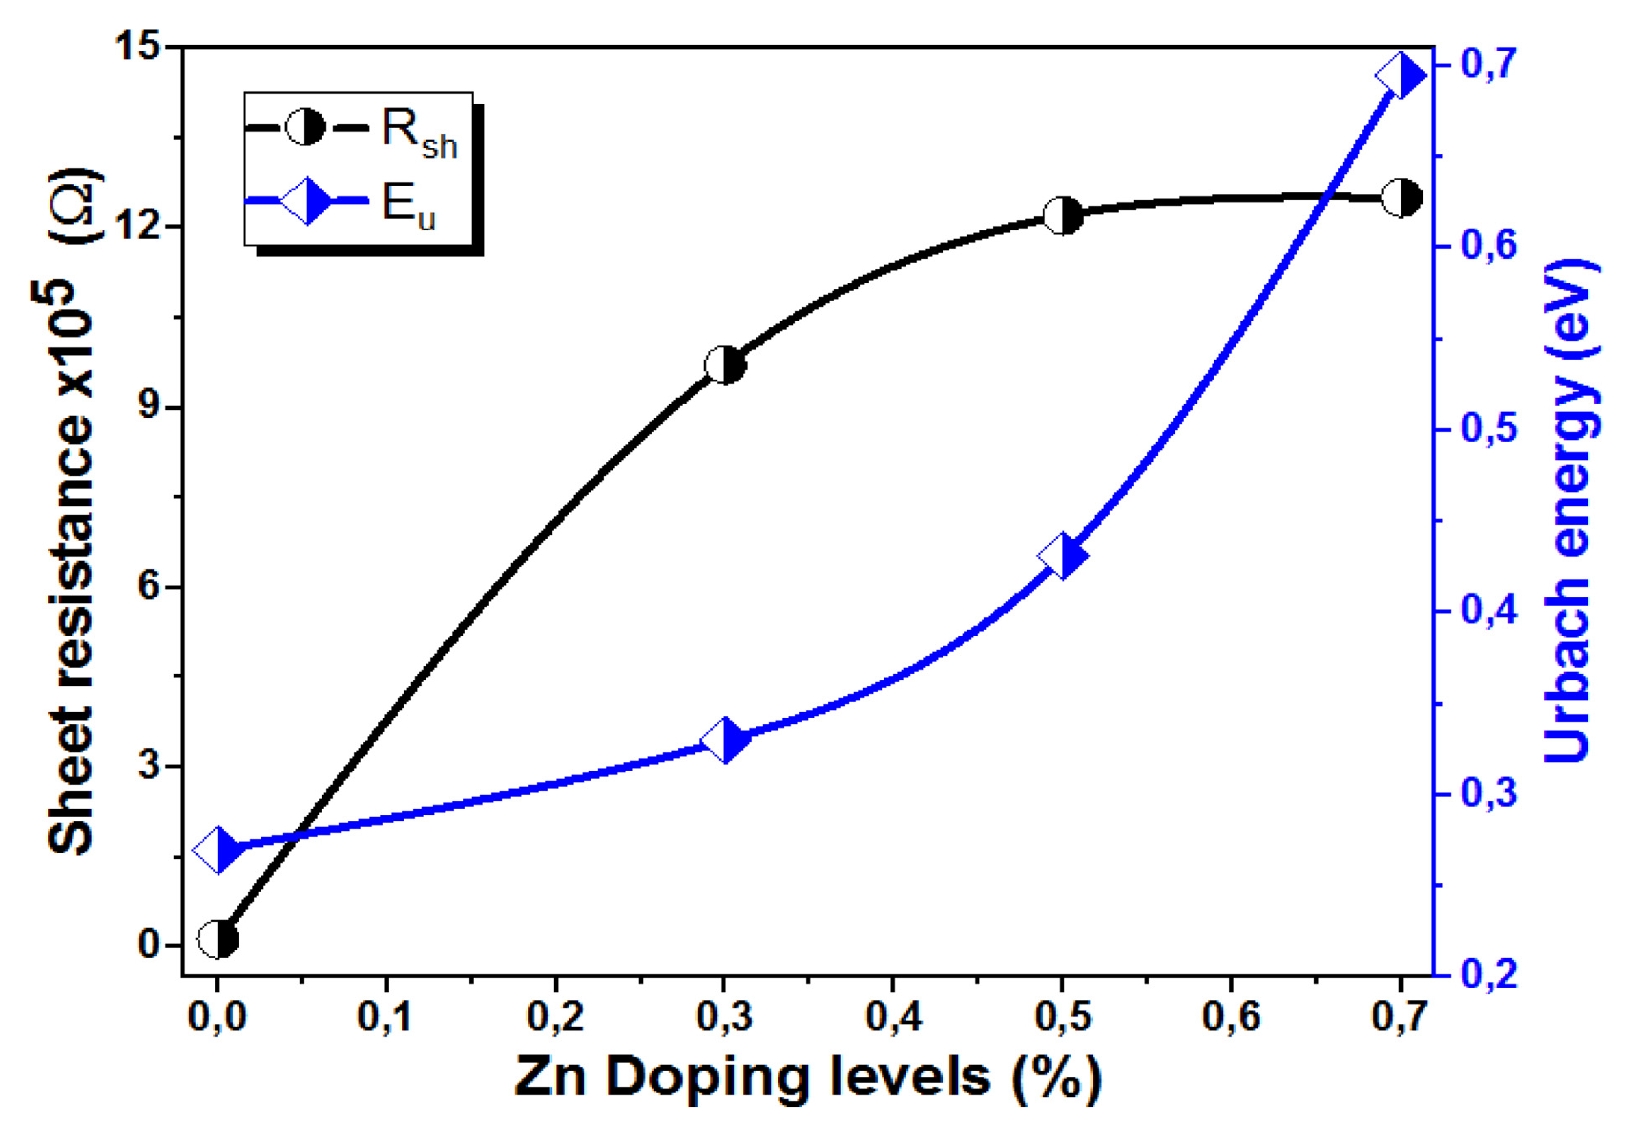
Table 1The structural parameters of Zn-doped MgO films with different Zn concentrations (x = 0, 0.3, 0.5 and 0.7 wt.%)
Table 1
|
Sample |
Diffraction peak [hkl] |
Diffraction angle 2θ [°] |
Interplanar spacing dhkl [Å] |
|
MgO |
(200) |
42.98 |
2.10270 |
|
(220) |
62.54 |
1.48399 |
|
Mg0.7Zn0.3O |
(111) |
36.75 |
2.44364 |
|
(200) |
42.83 |
2.10990 |
|
(220) |
62.19 |
1.49152 |
|
Mg0.5Zn0.5O |
(111) |
36.72 |
2.44550 |
|
(200) |
42.84 |
2.10938 |
|
(220) |
62.16 |
1.49219 |
|
Mg0.3Zn0.7O |
(002) |
31,75 |
2.81604 |
|
(101) |
34,66 |
2.58598 |
|
(100) |
36,51 |
2.45908 |
|
(111) |
36, 68 |
2.44807 |
|
(200) |
42,861 |
2.10826 |
|
(220) |
62,216 |
1.49094 |
Table 2Variation of crystallite sizes, microstrain and dislocation density of Mg1-xZnxO thin films extracted from XRD analysis as a function of Zn concentration (x = 0, 0.3, 0.5 and 0.7%)
Table 2
|
Sample |
Crystallite size D [nm] |
Lattic parameter a [A°] |
Strain [ɛ] 10−3
|
Dislocation density 1015 [lines/m2] |
|
MgO |
08.12 |
4.20138 |
1.37 |
15.17 |
|
Mg0.7Zn0.3O |
10.04 |
4.22366 |
2.57 |
9.92 |
|
Mg0.5Zn0.5O |
11.29 |
4.22502 |
3,00 |
7.84 |
|
Mg0.3Zn0.7O |
12.49 |
4.22458 |
3.07 |
6.41 |
Table 3Variation of the optical band gap energy Eg and the Urbach energy Eu of Mg1-xZnxO thin films as a function of Zn concentration (x = 0, 0.3, 0.5 and 0.7%)
Table 3
|
Sample |
Optical gap energy Eg [eV] |
Urbach energy Eu [eV] |
|
MgO |
3.56 |
0.270 |
|
Mg0.7Zn0.3O |
3.93 |
0.330 |
|
Mg0.5Zn0.5O |
3.64 |
0.431 |
|
Mg0.3Zn0.7O |
3.26 |
0.695 |
Table 4The variation of the sheet resistance of Mg1-xZnxO thin films as a function of Zn concentration (x = 0, 0.3, 0.5 and 0.7%)
Table 4
|
Sample |
Sheet resistance [Ω] |
|
MgO |
0,137E+05 |
|
Mg0.7Zn0.3O |
9,71E+05 |
|
Mg0.5Zn0.5O |
1,22E+06 |
|
Mg0.3Zn0.7O |
1,25E+06 |
Table 5Comparing between parameter of the crystallite size, the optical band gap and Electrical properties of Mg1-xZnxO thin films as a function of Zn concentration (x = 0, 0.3, 0.5 and 0.7%)
Table 5
|
Sample |
Method |
The Crystallite size [nm] |
The optical band gap [eV] |
Electrical properties |
Ref. |
(MgO)1-x(ZnO)x
x = 0 to 1 |
Pulsed lased deposition |
12.8 to 53.2 |
4.2 to 3.2 |
- |
[42] |
Zn1-xMgxO2
x = 0 to 1 |
Aerosol deposition method |
15 to 20 |
3.5 to 4.5 |
Resistivity in the range of about 10−2 to 10−4 Ω.cm |
[43] |
|
Mg1-xZnxO (x = 0, 0.3, 0.5 and 0.7) |
Spray pneumatic deposition |
08.12, 10.04, 11.29 and 12.49 |
3.56, 3.93, 3.64 and 3.26 |
Sheet resistance in the range of about 0.137 × 10⁵, 9.71 × 10⁵, 1.22 × 10⁶ and 1.25 × 10⁶ Ω |
This work |
REFERENCES
- 1. Anandan, K., Siva, D., Rajesh, K., (2018), Structural and optical properties of (ZnO/MgO) nanocomposites, International Journal of Engineering Sciences & Research Technology, 7(8), 493-499.
- 2. Senol, S. D., Boyraz, C., Ozugurlu, E., Gungor, A., Arda, L., (2019), Band gap engineering of Mg doped ZnO nanorods prepared by a hydrothermal method, Crystal Research and Technology, 54(3), 1800233.
- 3. Wang, M., Kim, E. J., Kim, S., Chung, J. S., Yoo, I., Shin, E. W., Hahn, S. H., Park, C., (2008), Optical and structural properties of sol–gel prepared MgZnO alloy thin films, Thin Solid Films, 516(6), 1124-1129.
- 4. Upadhya, K., Deekshitha, U., Antony, A., Ani, A., Kityk, I., Jedryka, J., Wojciechowski, A., Ozga, K., Poornesh, P., Kulkarni, S. D., (2020), Second and third harmonic nonlinear optical process in spray pyrolysed Mg: ZnO thin films, Optical Materials, 102, 109814.
- 5. Mahdjoub, A., Hafid, A., Salah, A. M., Benhaya, A., (2017), An original way to obtain porous Zn (1–x) MgxO thin films by spray pyrolysis technique, Semiconductor physics, Quantum Electronics & Optoelectronics, 55-63.
- 6. Visweswaran, S., Venkatachalapathy, R., Haris, M., Murugesan, R., (2020), Characterization of MgO thin film prepared by spray pyrolysis technique using perfume atomizer, Journal of Materials Science: Materials in Electronics, 31(17), 14838-14850.
- 7. Rouchdi, M., Salmani, E., Fares, B., Hassanain, N., Mzerd, A., (2017), Synthesis and characteristics of Mg doped ZnO thin films: Experimental and ab-initio study, Results in Physics, 7, 620-627.
- 8. Derbali, A., (2018), Élaboration et caractérisations physico-chimiques des couches minces de sulfure de zinc (ZnS) en vue d’applications photovoltaïques, Doctoral Thesis, Universite Mohamed Khider Biskra.
- 9. Yilmaz, M., Aydoğan, Ş, (2015), The effect of Pb doping on the characteristic properties of spin coated ZnO thin films: Wrinkle structures, Materials Science in Semiconductor Processing, 40, 162-170.
- 10. Roguai, S., Djelloul, A., (2021), Photocatalytic degradation of methylene blue using sprayed Mg diluted ZnO heterostructure thin films photocatalysts, Reaction Kinetics, Mechanisms and Catalysis, 132(2), 1225-1244.
- 11. Muthukumaran, S., Gopalakrishnan, R., (2012), Structural, FTIR and photoluminescence studies of Cu doped ZnO nanopowders by co-precipitation method, Optical Materials, 34(11), 1946-1953.
- 12. Abed, C., Fernández, S., Elhouichet, H., (2020), Studies of optical properties of ZnO: MgO thin films fabricated by sputtering from home-made stable oversize targets, Optik, 216, 164934.
- 13. Choudhury, S., (2016), Structural and optical characterization of magnesium doped zinc oxide thin films deposited by spray pyrolysis, Dhaka University Journal of Science, 64(1), 1-6.
- 14. Bedoud, K., Graine, R., Merabet, H., (2019), Propriétés Optique de TiO2 et Application de la Méthode de Swanepoel pour la Détermination de l’Épaisseur Optique et de l’Indice de Réfraction, Couches minces, pulvérisation, semi-conducteur, TiO2, nano-films, UV-Vis, épaisseur, indice de réfraction, International Journal of Scientific Research & Engineering Technology, 7, 20-23.
- 15. Boudjouan, F., Chelouche, A., Touam, T., Djouadi, D., Ouerdane, Y., (2016), Influence of Pb doping on the structural, morphological and optical properties of sol–gel ZnO thin films, Materials Science in Semiconductor Processing, 41, 382-389.
- 16. Soumahoro, I., Moubah, R., Schmerber, G., Colis, S., Ait Aouaj, M., Abd-Lefdil, M., Hassanain, N., Berrada, A., Dinia, A., (2010), Structural, optical, and magnetic properties of Fe-doped ZnO films prepared by spray pyrolysis method, Thin Solid Films, 518(16), 4593-4596.
- 17. Rouabah, N., Boudine, B., Nazir, R., Zaabat, M., Alqahtani, A. S., Alqahtani, M. S., Syed, R., (2021), Nanocomposite synthesis of silver doped magnesium oxide incorporated in PVC matrix for photocatalytic applications, Journal of Polymer Research, 28(5), 154.
- 18. Vashaei, Z., Minegishi, T., Suzuki, H., Hanada, T., Cho, M., Yao, T., Setiawan, A., (2005), Structural variation of cubic and hexagonal MgxZn1− xO layers grown on MgO (111)∕ c-sapphire, Journal of Applied Physics, 98(5), 054911.
- 19. Ashok, C., Rao, K., Chakra, C., Rao, K., (2016), Mgo nanoparticles prepared by microwave-irradiation technique and its seed germination application, Nano Trends: A Journal of Nanotechnology and Its Applications, 18(1), 10-17.
- 20. Obeid, B., Hameed, A., Alaaraji, H., (2017), Structural and optical properties of TiO2: MgO thin films preparing at 373K, Digest Journal of Nanomaterials and Biostructures, 12(4), 1239-1246.
- 21. Gahtar, A., Benramache, S., Ammari, A., Boukhachem, A., (2021), Study of the structural, optical, electrical and morphological properties of nickel sulfide thin films used in supercapacitors, Annals of West University of Timisoara-Physics, 63(1), 1-13.
- 22. Benramache, S., Guezzoun, H., Benhaoua, B., (2020), Synthesis and characterizations of nanocrystalline Na and Al codoped NiO thin films, International Journal of Integrated Engineering, 12(1), 204-209.
- 23. Benramache, S., Rahal, A., Benhaoua, B., (2014), The effects of solvent nature on spray-deposited ZnO thin film prepared from Zn (CH3COO) 2, 2H2O, Optik, 125(2), 663-666.
- 24. Mohammad Shafiee, M. R., Kargar, M., Ghashang, M., (2018), Characterization and low-cost, green synthesis of Zn2+ doped MgO nanoparticles, Green Processing and Synthesis, 7(3), 248-254.
- 25. Faisal, S., Naqvi, S., Ali, M., Lin, L., (2022), Comparative study of multifunctional properties of synthesised ZnO and MgO NPs for textiles applications, Pigment & Resin Technology, 51(3), 301-308.
- 26. Hwang, J., Zhan, Y., (2023), Effects of oxygen contents on the physical properties of MgO films and carrier transport of Au/MgO/ZnO MIS diodes, Ceramics International, 49(17), 28098-28106.
- 27. Zhao, H., Wang, Q., Zhao, M., Jiang, D., Liang, Q., (2026), Dual operating mode imaging photodetector based on electrical modulation of p-Si/MgO/ZnO, Energy & Environmental Materials, e70346.
- 28. Gnanasambandan, P., Adjeroud, N., Leturcq, R., (2022), Role of ZnO and MgO interfaces on the growth and optoelectronic properties of atomic layer deposited Zn1− xMgxO films, Journal of Vacuum Science & Technology A, 40(6), 062413.
- 29. Benramache, S., Benhaoua, B., (2012), Influence of annealing temperature on structural and optical properties of ZnO: In thin films prepared by ultrasonic spray technique, Superlattices and Microstructures, 52(6), 1062-1070.
- 30. Benramache, S., Benhaoua, B., (2012), Influence of substrate temperature and Cobalt concentration on structural and optical properties of ZnO thin films prepared by Ultrasonic spray technique, Superlattices and Microstructures, 52(4), 807-815.
- 31. Benramache, S., Benhaoua, B., Guezzoun, H., (2020), Study the effect of Cu doping on optical and structural properties of NiO thin films, Annals of West University of Timisoara-Physics, 62(1), 15-22.
- 32. Abhijith, A., Srivastava, A., Srivastava, A., (2020), Synthesis and characterization of magnesium doped ZnO using chemical route, Journal of Physics: Conference Series, 1531(1), 012005.
- 33. El Hamidi, A., El Mahboub, E., Meziane, K., El Hichou, A., Almaggoussi, A., (2021), The effect of electronegativity on optical properties of Mg doped ZnO, Optik, 241, 167070.
- 34. Kulandaisamy, A. J., Reddy, J. R., Srinivasan, P., Babu, K. J., Mani, G. K., Shankar, P., Rayappan, J. B. B., (2016), Room temperature ammonia sensing properties of ZnO thin films grown by spray pyrolysis: Effect of Mg doping, Journal of Alloys and Compounds, 688, 422-429.
- 35. Akshaykranth, A., Jayarambabu, N., Venkatappa Rao, T., Rakesh Kumar, R., (2022), Influence of mgo and zno nanofillers on morphology, structural, thermal and mechanical properties of polylactic acid films, Bulletin of Materials Science, 45(4), 247.
- 36. Hasan, A. A., (2022), Synthesis and dielectric properties of MgO: ZnO composites, Iraqi Journal of Science, 5232-5241.
- 37. Prashanna Suvaitha, S., Divya, T., Sridhar, P., Palani, P., Venkatachalam, K., (2023), Optical and biological properties of MgO/ZnO nanocomposite derived via eggshell membrane: a bio-waste approach, Bioprocess and Biosystems Engineering, 46(1), 39-51.
- 38. Kalyani, P., Muthupandeeswari, T., (2022), Investigation on the altered properties of PVA filled magnesium oxide composite (PVA@ xMgO) thin films, Polymer Bulletin, 79(11), 10115-10134.
- 39. Mohammed, R. S., Aadim, K. A., Ahmed, K. A., (2022), Estimation of in vivo toxicity of MgO/ZnO core/shell nanoparticles synthesized by eco-friendly non-thermal plasma technology, Applied Nanoscience, 12(12), 3783-3795.
- 40. Chaouch, N., Benramache, S., Lakel, S., (2020), Synthesis and characterization of physical properties of MgO thin films by various concentrations, Journal of Microelectronics and Electronic Packaging, 17(1), 23-27.
- 41. Sheema Jamal, Q., Uddin, M., Khan, A. R., Zafar, S., (2024), Malvastrum coromandelianum mediated bio-fabrication of mgo: Zno nanocomposites and their biological potential, Journal of Inorganic and Organometallic Polymers and Materials, 34(11), 5636-5650.
- 42. Hasan, B. A., (2021), Investigating the effect of zno on the structural and optical properties of (mgo) 1-x (zno) x via pulsed laser deposition, Journal of Physics: Conference Series, 012032.
- 43. Morari, V., Suman, V., Rusu, E. V., Ursaki, V. V., (2025), Enhancing the conductivity of al-doped znmgo films via aerosol deposition method, Proceedings of the 7th International Conference on Nanotechnologies and Biomedical Engineering, 30-39.
Biography
- Nadjat Chaouch
Assistance Professor in the Department of Process Engineering, Faculty of Technology, University of Batna 2, Algeria. His/Her research interest is precision Thin films Materials.
- Amira Sbaihi
Ph.D. candidate in the Department of Physics, Biskra University, Algeria. Her research interest is precision Thin films Materials.
- Said Lakel
Professor in the Department of Physics, Biskra University, Algeria. His research interest is semiconductor materials and Thin films.
- Abdelghani Lakel
Professor in the Department of Physics, Biskra University, Algeria. His research interest is semiconductor materials.
- Said Benramache
Professor in the Department of Physics, Biskra University, Algeria. His research interest is semiconductor materials.