ABSTRACT
Ethanol poses a significant threat to driver safety, as its effects vary with blood alcohol concentration (BAC). Common methods for estimating BAC include breath alcohol analysis, which calculates BAC from the alcohol concentration in exhaled breath, and direct blood sampling. However, these methods have notable limitations. This study aims to classify alcohol concentration using non-invasive optical signal data obtained from biomimetic samples with varying alcohol levels. To replicate the high scattering characteristics of biological tissue, scattering effects were induced in the samples, and absorbance was measured using near-infrared (NIR) wavelengths, which penetrate biological tissue more deeply. A Random Forest (RF) model was trained using the measured absorbance values to classify alcohol concentration levels. The Area Under the ROC Curve (AUC) for each concentration level indicated effective model learning, and the classification results on the test set demonstrated statistically significant accuracy. These findings suggest that the RF model can classify alcohol concentrations non-invasively and without the loss of samples. Furthermore, incorporating additional optical properties beyond absorbance may improve the accuracy of future non-invasive alcohol concentration classification models.
-
KEYWORDS: Non-invasive, Artificial intelligence, Random forest, Spectroscopy, Biomimetic sample
-
KEYWORDS: 비침습, 인공지능, 랜덤 포레스트, 분광법, 생체 모사 샘플
1. 서론
알코올은 인간이 섭취하는 술의 주성분으로 사용되는 항정신성 약물이다[
1]. 알코올의 섭취는 섭취자에게 운동 실조, 기억 상실, 수면 유도 그리고 의식 소실 등의 다양한 문제를 유발하게 된다[
2]. 이렇듯 알코올은 섭취자의 운동 능력과 상환 판단 능력에 치명적인 영향을 미치는 물질이다.
음주운전의 교통사고 관여율은 연령에 의한 교통사고 관여율보다 더욱 강한 상관관계를 갖는다는 연구결과가 있으며 특히 치명적인 사고의 가장 중요한 단일 원인으로 간주되기도 한다[
3]. 또한, 음주 운전은 운전시 차선을 유지하는 능력에 직접적인 악영향을 미친다는 연구가 보고되고 있다[
4]. 또한, 음주 운전으로 인한 유죄 판결을 받은 개인의 5년 내 재범률은 전 세계적으로 21-47%로 보고되고 있다[
5]. 이렇듯 운전자의 알코올 섭취는 운전자의 운전 능력을 감소시키고 이는 치명적인 사고로 연결이 될 수 있으며 재범률 또한 매우 높은 사회적인 문제이다[
6].
그렇기에 세계적으로 음주에 의한 교통사고를 방지하기 위해 운전자의 음주를 제한하기 위한 다양한 정책을 시행하고 있다. 하지만 이러한 정책들이 음주운전을 완전하게 억제하고 있지는 못하고 있으며 음주 운전에 대한 재범율은 여전히 높다는 보고가 있다[
7]. 그에 따라 최근에는 음주운전 시동 잠금 장치의 중요성이 대두되고 있으며 시동 잠금 장치의 강력한 음주운전 억제력을 뒷받침하는 선행연구도 많이 보고되고 있다[
8,
9].
음주운전 시동 잠금 장치에 일반적으로 사용되는 혈중 알코올 농도(BAC) 측정법은 호기식 측정법을 사용하고 있다. 하지만 호기식 측정법은 손 소독제, 구강 세정제, 담배, 음식, 치과 기구 등과 같은 외부요인에 의한 오류로 인해 측정 정확도가 항상 정확하지 않다는 단점이 있다[
10]. 또한, 대한민국에서는 호기식 측정법에서 사용되는 BAC와 호흡 알코올 농도(BrAC) 간의 비(BBR)는 2100 : 1을 사용하고 있지만 이는 개인별 차이가 존재하며 1300 : 1에서 2700 : 1의 범위로 보고되고 있다[
11,
12]. 이러한 개인별 차이로 인해 호기식 측정법에 의한 알코올 농도 측정은 정확한 BAC를 측정하는 데에 한계가 존재한다. 그 외에도 경피 센서를 이용하여 비침습적으로 알코올의 농도를 측정하려는 연구도 선행되었다[
13,
14]. 하지만 에탄올이 혈액에 흡수되고 땀으로 배출되는 데 걸리는 시간 지연과 카트리지 교체라는 단점이 존재하고 있다. 그 외에도 땀을 기반한 전기화학 센서를 이용한 방법 은 개인마다 다른 땀 생성량, 체온과 같은 요인에 의한 오차 등이 보고되고 있다[
15]. 또한, 차량 내부의 공기를 감지하여 알코올을 측정하는 방법의 경우 구강 청결제나 차량용 방향제와 같이 알코올을 함유한 물질에 의한 정확도 감소 등의 문제점이 있다[
16]. OECT (Organic Electrochemical Transistor) 기반의 에탄올 센서도 보고되고 있지만 해당 센서는 일회용 장치이기에 장기간 사용이 어렵다는 단점이 존재하고 있다[
17]. 이렇듯 비침습적으로 BAC를 측정하기 위한 다양한 방법이 존재하지만 각기 다른 단점으로 인해 음주운전 시동 잠금 장치에 적용하기에는 한계가 존재한다. 그렇기에 음주운전 시동 잠금 장치에 적용할 수 있는 비침습적인 BAC 측정에 사용할 수 있는 기술이 필요하다.
빛은 파장에 따라 생체를 침투하는 깊이의 차이가 있다[
18]. 특히 근적외선 영역의 빛은 깊은 생체 침투 깊이를 가진다는 특성이 있으며 이러한 특성으로 인해 다양한 의료 생체 분야에서 활용되고 있다[
19-
21].
한편, 에탄올 분자는 근적외선 영역에서 고유의 진동 에너지 준위 변화에 해당하는 배음대(Overtone Band) 및 결합대(Combination Band)를 갖는다[
22]. 이러한 결합에 의한 에너지 흡수는 근적외선 분광법을 통해 감지될 수 있다. 이를 통해 근적외선 분광법을 이용하면 비침습적으로 에탄올의 농도를 추정할 수 있게 된다.
이처럼 근적외선의 높은 생체 침투 깊이와 근적외선 영역에서 에탄올의 배음대와 결합대에 의해 발생하는 분광학적 특성을 결합한다면 기존의 호기식 에탄올 측정법의 단점을 보완할 수 있는 비침습적 알코올 측정이 가능할 것으로 예상된다.
본 연구는 비침습적으로 알코올 농도를 측정하기 위해 분광법을 사용하였다. 분광법으로 얻어진 흡광도를 통해 비침습적으로 생채 모사 매질의 알코올 농도를 분류할 수 있는지에 대한 가능성을 살펴보았으며 이를 위해 머신 러닝에서 널리 사용되고 있는 앙상블 기법의 하나인 Random Forest (RF) 모델을 이용하여 해당 모델의 분류 정확도와 여러 성능 지표를 확인하였다.
2. 샘플 준비 및 측정
2.1 생체 모사 샘플 제작
생체는 기본적으로 투명하지 않고 산란성이 매우 높은 매질이다. 이를 위해 생체 모사 샘플의 제작에서 산란체로 널리 사용되고 있으며 생체 내 세포와 세포 소기관과 유사한 산란 특성을 보이는 우유를 산란체로 첨가하여 샘플을 제작하였다[
23-
25]. 이때 각각의 샘플에는 동일한 양의 우유를 첨가하였으며 증류수에 에탄올 수용액을 첨가하여 0%에서 40%까지 에탄올 농도를 10%씩 증가하여 액체 샘플을 제작하였다. 이때 각 샘플의 용량은 100 ml로 고정하였으며 모든 샘플은 투명한 유리 용기에 담아 측정에 사용하였다.
샘플의 광학적 신호를 사용할 분광 모듈로는 생체 침투 깊이가 깊은 근적외선 영역의 분광 모듈(DLP NIRscan Nan o EVM, Texas Instruments)을 사용하였다. 해당 모듈을 통해 약 901.82 nm의 파장부터 약 1700.93 nm의 파장까지 약 3 n m의 간격으로 228개의 파장에 따른 광신호를 얻을 수 있다. 분광 모듈과 샘플 사이에는 Slide Glass를 두어 측정시마다 발생할 수 있는 분광 모듈과 샘플 사이의 거리에 의해 발생하는 오류를 최소화하였으며 분광 모듈의 윈도우에 발생할 수 있는 손상을 최소화하였다. 실험을 위해 구성한 광학 테이블의 측정 시스템 셋업은
Fig. 1과 같다.
Fig. 1에서 구성된 측정 시스템을 통해 얻어진 흡광도 데이터는 노트북에 엑셀 형식으로 저장된다. 한번의 측정으로 인해 저장되는 파일의 형식은 각각 229 × 2 행렬이다. 모든 파일의 1행은 헤더로 각각의 열이 무엇을 의미하는 지를 나타내고 있으며 1열은 파장에 대한 정보를 2열에서는 해당 파장에서의 광신호에 대한 정보를 담고 있다. 해당 측정을 통해 얻어진 데이터의 분포는
Table 1과 같다.
3. 데이터 전처리 및 머신러닝
3.1 데이터 전처리
측정된 광신호에 대한 머신 러닝을 수행하기에 앞서 흡광도의 원데이터를 플로팅(Plotting)하여 데이터의 이상 여부를 확인하였다. 그 결과 특정 파장에서 일부 데이터에 결측값이 존재함을 알 수 있었다. 결측값에 의해 모델의 성능이 저하되는 것을 방지하기 위해 동일한 레이블에 있는 데이터에서 동일한 파장에서의 광신호 값의 평균을 이용하여 결측값을 보간하였다.
모델의 일반화 성능을 공정하게 평가하기 위해 각 농도별로 데이터를 6 : 2 : 2의 비율로 무작위 분할하여 각각 학습용(Train Dataset), 검증용(Validation Dataset), 테스트용(Test Dataset)으로 선정하였다. 각각의 농도별로 데이터를 분할한 이유는 농도별로 샘플 수의 차이가 존재하기 때문에 각 농도에서 데이터의 분포를 균일하게 반영하기 위함이다.
3.2 랜덤 포레스트 모델 개발
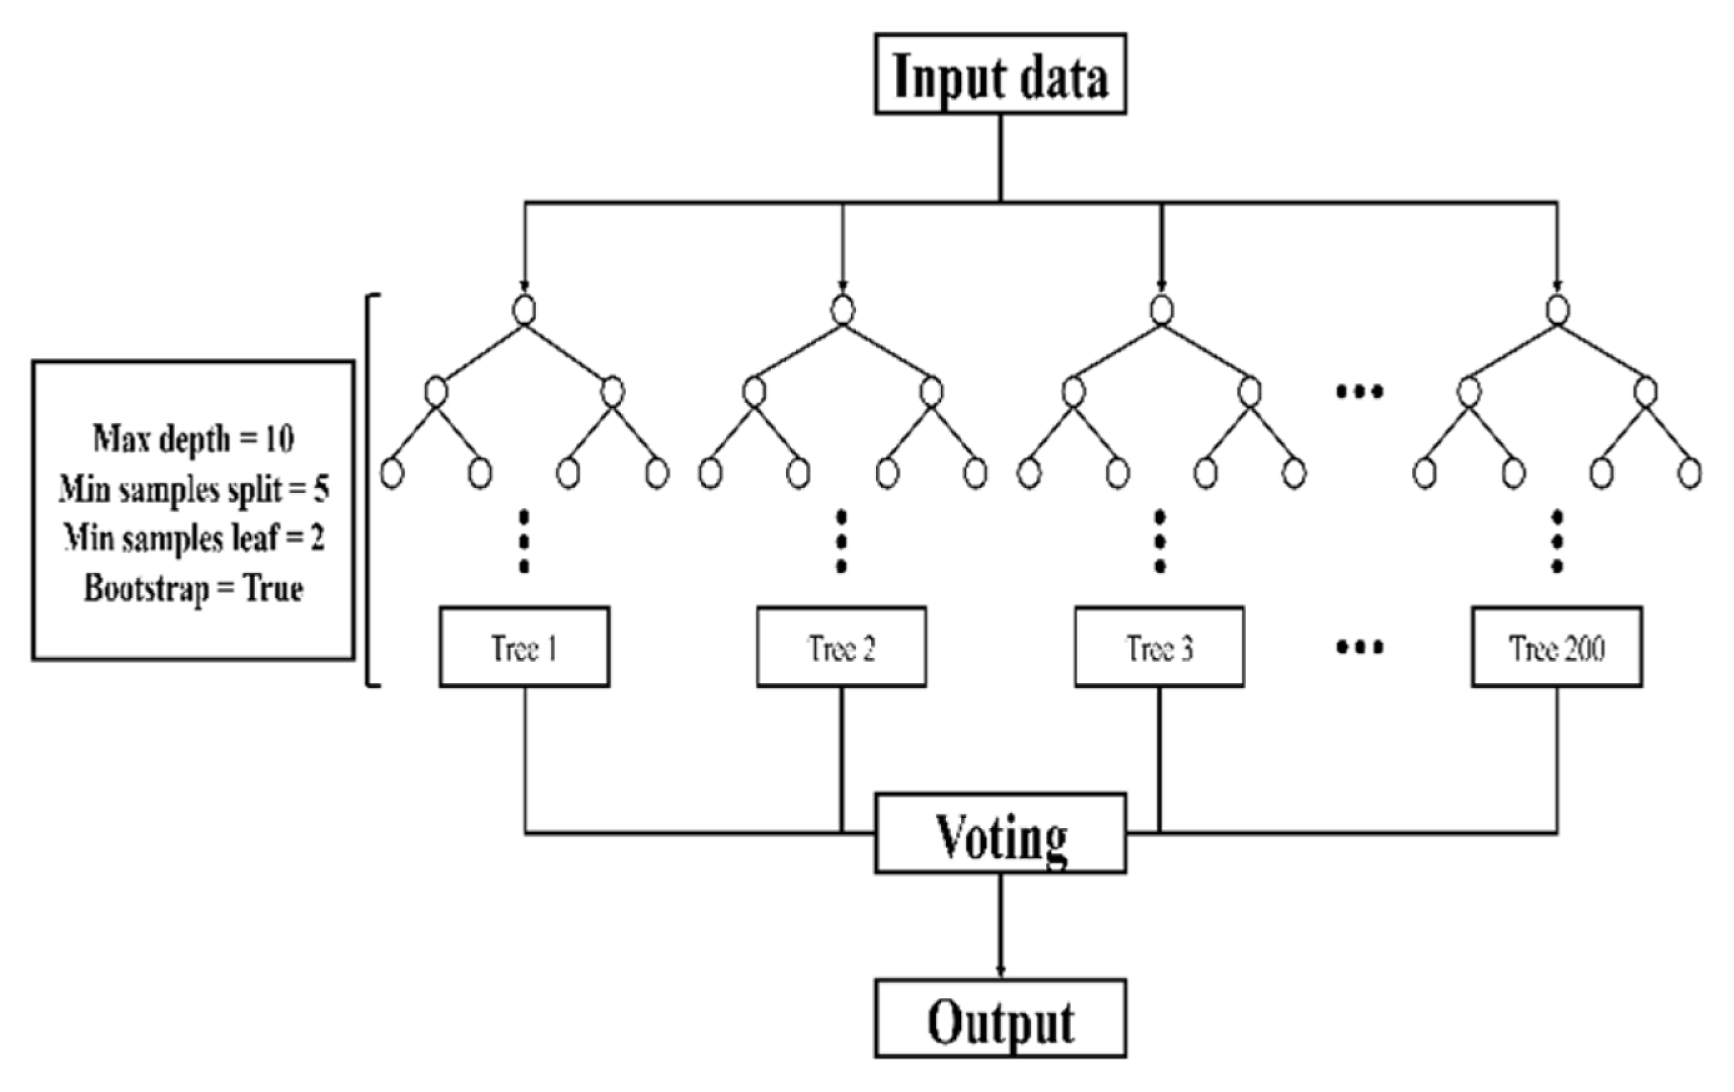
얻어진 데이터를 각각의 알코올 농도에 맞도록 분류하기 위해 설계된 Random Forest 모델은 200개의 트리가 병렬로 연결된 구조이며 각각의 트리에서 산출된 결과의 다수결에 의해 분류가 진행이 되었다. 각각의 트리의 최대 깊이는 10으로 설정하였으며 노드를 분할하기 위한 최소 샘플의 개수는 5개로 설정하였다. 최종적으로 리프 노드의 최소 샘플의 수는 2개로 설정하였으며 분할을 위해 설계한 모델의 아키텍처는
Fig. 2와 같다.
4. 결과 및 고찰
설계된 Random Forest 모델을 이용한 데이터의 분류 결과 Validation Dataset에서는 0.8771의 정확도를 확인할 수 있었으며 Test Dataset에서는 0.8432의 정확도를 보였다. 또한, 데이터의 불균형에 의한 성능 저하를 검토하기 위해 각 클래스별 F1-score를 비교하였다. 그 결과 데이터의 수가 상대적으로 적은 0%와 10% 클래스에서는 높은 F1-score를 보였지만 20%와 30% 클래스에서는 낮은 F1-score를 보였다. 이러한 결과는 데이터의 불균형에 의해서가 아닌 데이터가 가진 고유한 특성이 원인으로 작용했을 가능성이 높다. 실제 데이터를 플로팅 하였을 때 해당 농도에서는 STD 값이 크고 농도별로 중첩이 발생하는 구간이 있음을 확인할 수 있었다. 이를 통해 해당 농도 구간에서는 데이터의 고유한 특성에 의해 F1-score가 낮게 나타난 것으로 판단된다.
Table 2는 Test Dataset에서의 분류 보고서를 나타내고 있다.
Fig. 3은 Random Forest 모델의 예측 결과를 혼돈행렬로 나타낸 그림이다.
Fig. 3(a)는 Validation Dataset에서의 예측을 나타내며 전체 농도에 대한 분류 정확도는 0.8771임을 확인할 수 있었다.
Fig. 3(b)는 Test Dataset에서의 예측을 나타내며 전체 농도에 대한 분류 정확도는 0.8432임을 확인할 수 있었다.
Test Dataset에서 모델의 성능을 나타내는 다른 지표 중의 하나인 ROC (Receiver Operating Characteristic) 커브의 AUC (Area Under Curve)를 보면 전체 농도에 대한 AUC의 평균은 0.9774임을 확인할 수 있었다. 각각의 농도에 따른 AUC는 모두 0.9 이상으로 전체적으로 좋은 성능을 보인다는 것을 볼 수 있다.
Fig. 4는 해당 모델에 대한 ROC 커브와 AUC를 나타내고 있다.
Table 3은 파장별 특성 중요도를 기준으로 상위 10개의 파장을 제시한 것이다. 표에서 확인할 수 있듯이 해당 모델은 근적외선 분광 영역에서 알코올의 주요 흡수 대역으로 알려진 950-1180 nm 구간의 파장에 높은 특성 중요도를 부여하였다. 이를 통해 해당 모델이 근적외선 영역에서 알코올에 의한 광신호를 주요 특성으로 설정한 것임을 알 수 있다.
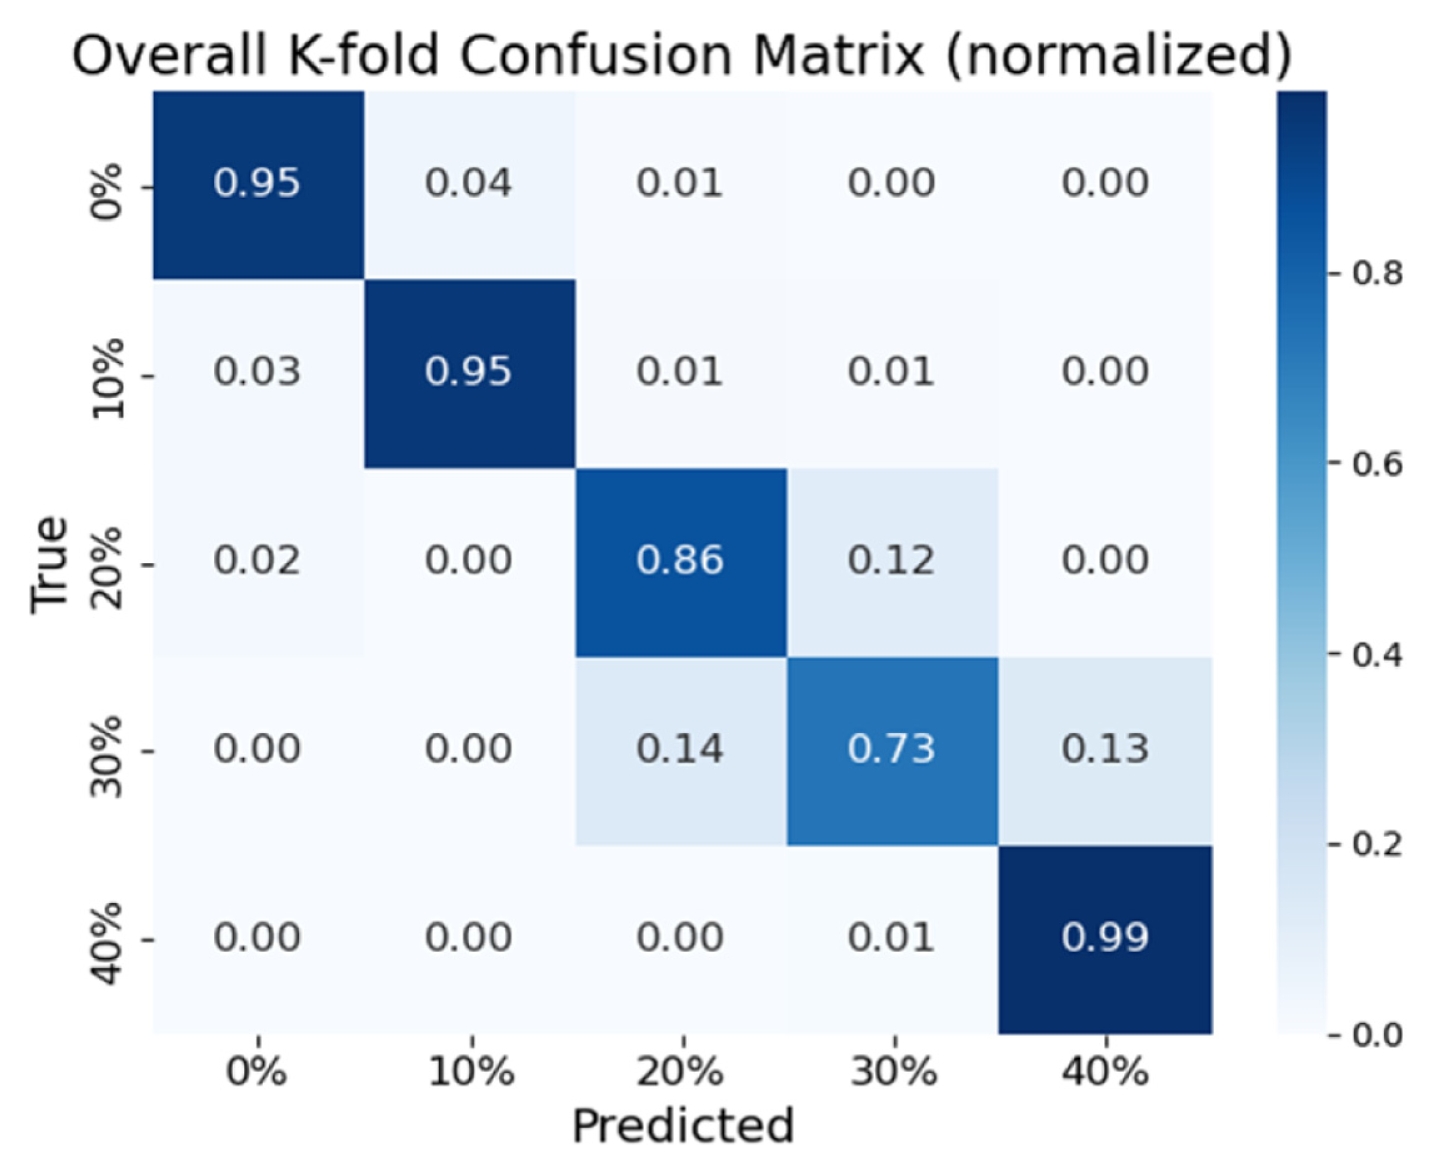
해당 모델의 일반화 성능을 판단하기 위해 5-fold 교차 검증을 시행한 결과 각각의 폴드에서 평균적인 정확도는 0.8898이 나왔으며 STD는 0.0154가 나옴을 확인할 수 있었다. 이는 Test Set (0.8432)의 정확도 그리고 Validation Set (0.8771)의 정확도와 유사한 값이고 이를 통해 해당 모델은 학습을 위해 사용되는 데이터의 분할에 따라 성능이 크게 변동하지 않음을 알 수 있었다. 이는 해당 모델은 일반화 성능을 확보하였다 것을 의미한다.
Fig. 5는 해당 모델에 대한 K-fold 교차 검증에 의한 분류 결과이다.
본 연구는 알코올 농도에 따른 광신호를 머신 러닝 모델을 이용하여 분류가 가능한지에 대한 기초 연구로 분류에 사용된 알고리즘으로는 Random Forest를 사용하였다. 모델의 분류 결과 2번의 검증 단계에서 모두 80% 이상의 정확도를 보였으며 AUC 또한 0.9774로 좋은 성능을 보이는 모델이라고 할 수 있다. 하지만 혼돈 행렬에서 20%와 30%의 알코올 농도를 구분하는 데에는 어려움이 있는 것을 확인할 수 있었다. 이는 Raw Data의 Plotting을 확인하였을 때 해당 농도에서 STD가 크며 그로 인해 중첩되는 부분이 많아 머신 러닝 모델이 해당 농도에서의 패턴을 파악하는데 어려움을 겪었기 때문이라고 판단된다. 이를 해결하기 위해서는 각 농도에 따른 광신호만을 입력으로 사용하는 것이 아닌 각각의 Raw Data에서 패턴 분석에 유의미한 특성을 찾고 추가 입력 변수로 활용함으로써 데이터의 중첩에 의해 발생하는 정확도의 감소를 해결할 수 있을 것으로 사료된다.
추후 연구에서 머신 러닝의 알고리즘을 Random forest 모델에만 국한하는 것이 아닌 SVM, MLP 등과 같은 다른 알고리즘 모델을 설계하여 각각의 모델의 정확도를 비교하여 비침습적으로 샘플의 알코올 농도를 측정하는데 최적의 알고리즘을 선택하게 된다면 해당 분류 모델의 정확도를 향상시킬 수 있을 것으로 예상된다. 또한 흡광도에 대한 데이터만 학습에 사용하는 것이 아닌 해당 데이터에서 얻을 수 있은 다양한 메타 특성을 사용한다면 정확도를 더욱 개선할 수 있을 것으로 예상된다.
5. 결론
본 연구에서는 비침습적으로 얻어진 광신호를 인공지능 모델을 이용하여 분류하였다. 광신호에 따른 알코올 농도를 분류하기 위해 Random Forest 모델을 설계하였으며 그 결과 농도 분류에 있어서 유의미한 정확도를 얻을 수 있었다. 향후 연구에서는 다층으로 구성되어있는 생체 조직의 산란 특성을 반영하기 위해 표피층 및 피하층을 모사한 다층 구조의 샘플을 제작하여 농도에 의한 광신호의 변화를 분류할 예정이다.
추후 다양한 알고리즘 모델의 분류 정확도를 비교하여 데이터에 맞는 최적의 모델을 설계하고 개인 및 인종별로 다른 피부 특성을 고려한 광학적 분류모델을 개발한다면 비침습적인 알코올 농도 분류의 정확도를 더욱 향상시킬 수 있을 것으로 예상된다. 또한, 본 연구를 통해 개발된 모델을 음주운전 시동 잠금장치에 적용하게 된다면 기존의 호기식 측정법의 단점인 외부요인(ex. 음식, 동승자의 음주, 개인별 BBR의 차이 등)에 의해 발생하는 오류를 해결할 수 있을 것으로 예상이 된다.
Fig. 1Measurement setup on the optical table for the experiment
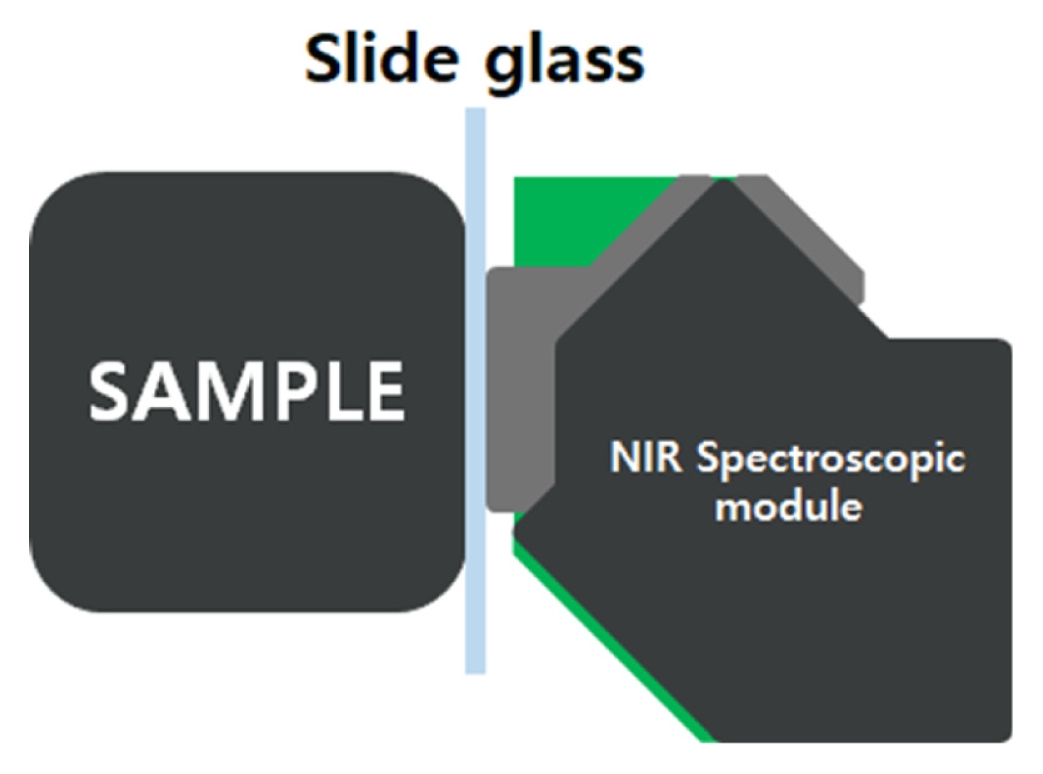
Fig. 2The architecture of the random forest model used for alcohol concentration classification

Fig. 3Confusion matrix for each dataset. (a) Confusion matrix for the validation dataset, (b) Confusion matrix for the test dataset
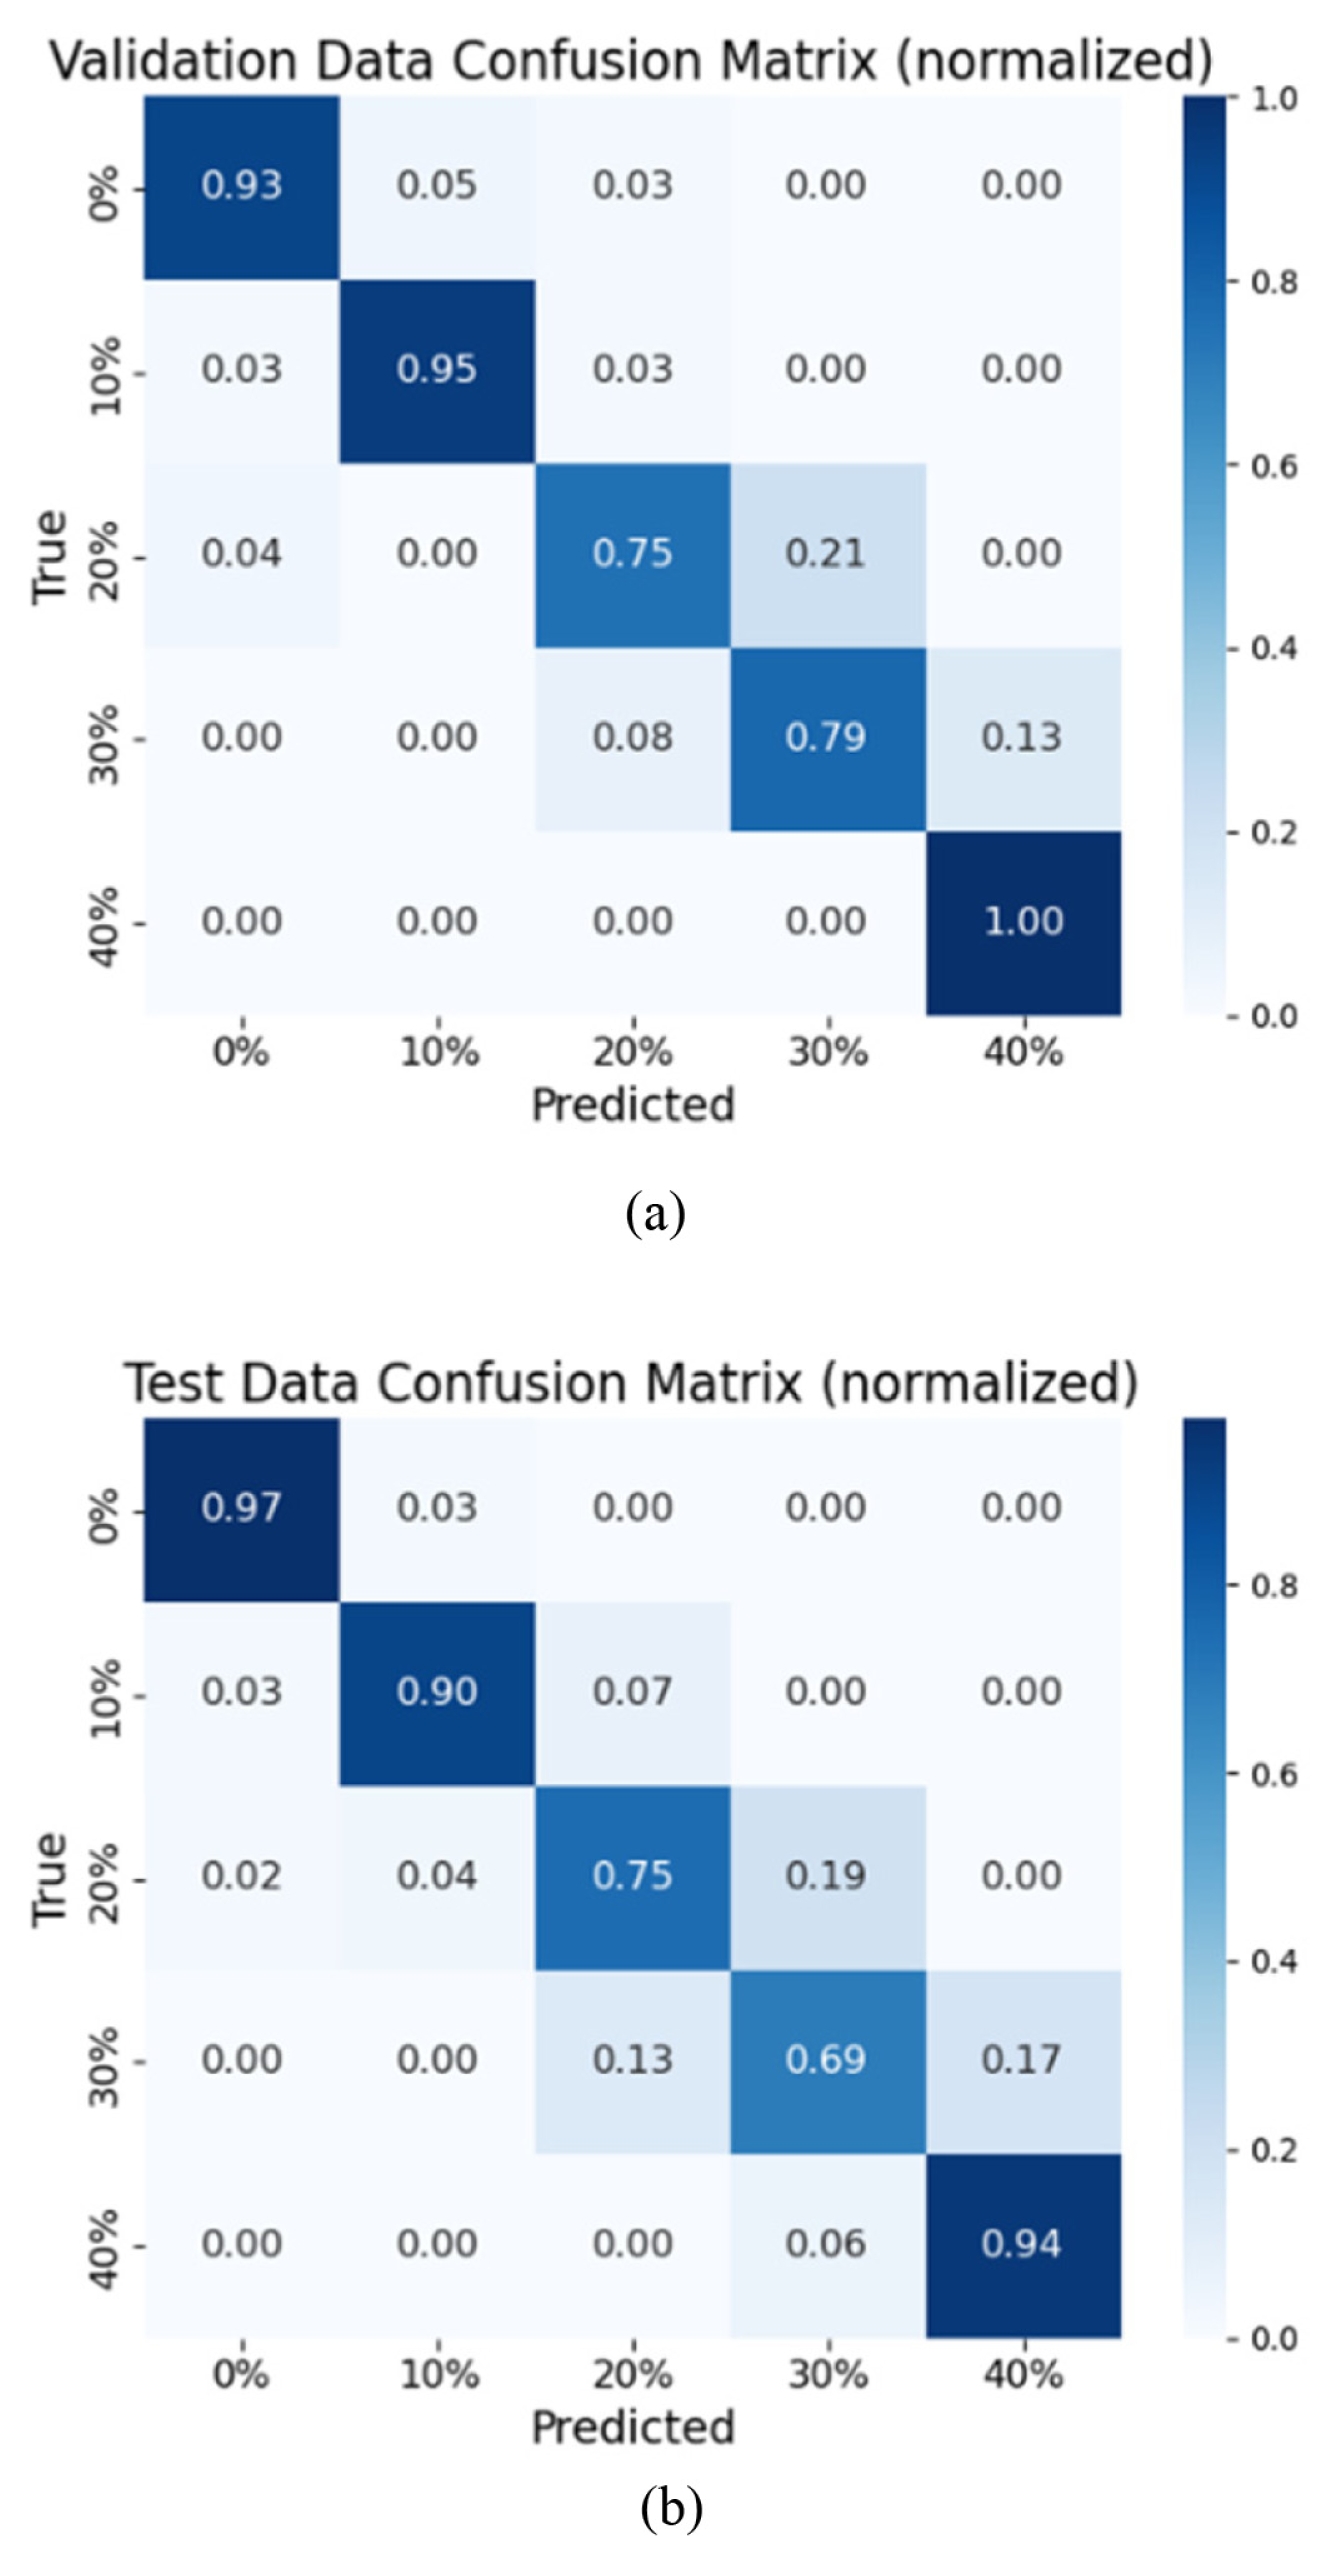
Fig. 4ROC curve and AUC for the test dataset of the classification model
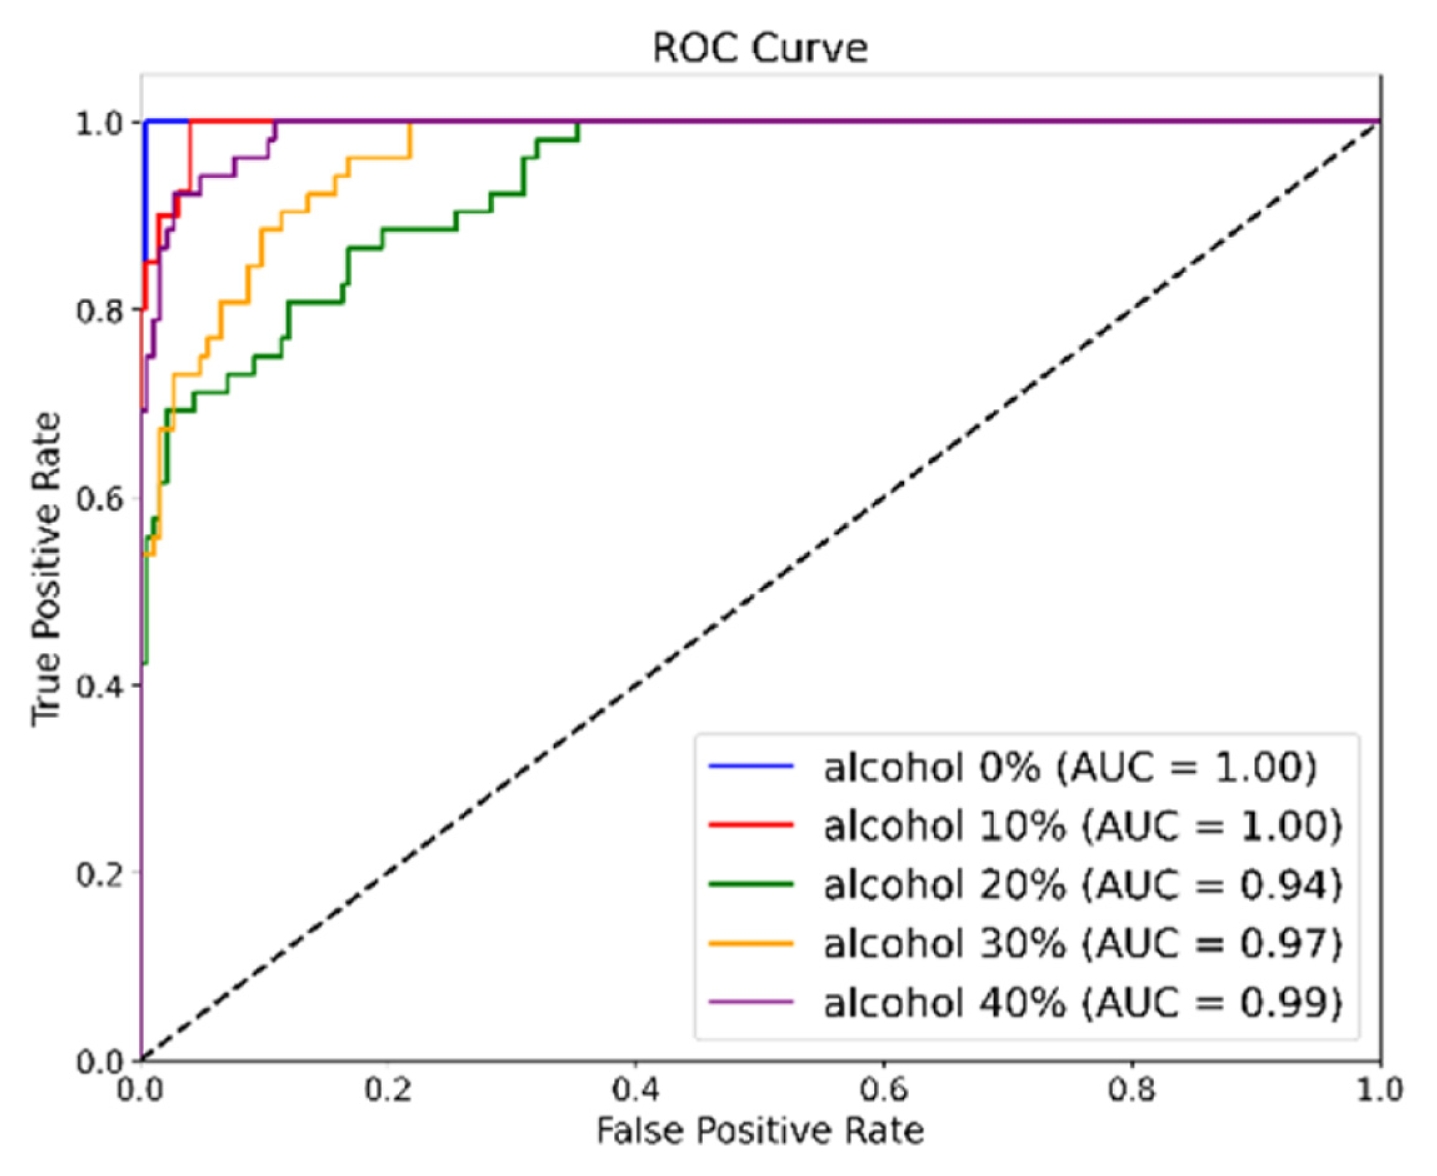
Fig. 5Classification results based on k-fold cross-validation

Table 1The number of samples collected per concentration level through measurement
Table 1
|
Alcohol concentration [%] |
Number of measured samples |
|
0 |
200 |
|
10 |
200 |
|
20 |
260 |
|
30 |
260 |
|
40 |
260 |
Table 2Classification report of the random forest model
Table 2
|
Concentration [%] |
Precision |
Recall |
F1-score |
|
0 |
0.95 |
0.97 |
0.96 |
|
10 |
0.92 |
0.90 |
0.91 |
|
20 |
0.80 |
0.75 |
0.77 |
|
30 |
0.73 |
0.69 |
0.71 |
|
40 |
0.84 |
0.94 |
0.89 |
|
Accuracy |
|
|
0.84 |
|
Macro avg |
0.85 |
0.85 |
0.85 |
|
Weighted avg |
0.84 |
0.84 |
0.84 |
Table 3Top 10 wavelength feature importances
Table 3
|
Rank |
Wavelength [nm] |
Feature importance |
|
1 |
1067 |
0.020403 |
|
2 |
1089 |
0.019973 |
|
3 |
1074 |
0.019651 |
|
4 |
1058 |
0.019146 |
|
5 |
1040 |
0.018781 |
|
6 |
1047 |
0.018591 |
|
7 |
1055 |
0.018089 |
|
8 |
1043 |
0.017885 |
|
9 |
1078 |
0.017672 |
|
10 |
1062 |
0.017059 |
REFERENCES
- 1. Kim, M. S., Lee, D. H., Kwon, S. B., (2023), The effects of alcohol intake on ohcs activity1, Journal of Speech, 32(1), 037-044.
- 2. Varghese, J., Dakhode, S., (2022), Effects of alcohol consumption on various systems of the human body: A systematic review, Cureus, 14(10.
- 3. Peck, R. C., Gebers, M. A., Voas, R. B., Romano, E., (2008), The relationship between blood alcohol concentration (BAC), age, and crash risk, Journal of Safety Research, 39(3), 311-319.
- 4. Iwata, M., Iwamoto, K., Kitajima, I., Nogi, T., Onishi, K., Kajiyama, Y., Nishino, I., Ando, M., Ozaki, N., (2021), Validity and reliability of a driving simulator for evaluating the influence of medicinal drugs on driving performance, Psychopharmacology, 238(3), 775-786.
- 5. Huang, M.-C., Fang, S.-C., Chang, H.-M., Yang, T.-W., Tu, H.-Y., Chang, Y.-T., Cheng, W.-J., (2023), Postintervention reoffense in dui repeat offenders receiving alcohol treatment as a diversion intervention: A 2-year follow-up study, Transportation Research Part F: Traffic Psychology and Behaviour, 94, 413-421.
- 6. Jou, R.-C., Lu, Y.-H., (2021), Factors affecting recidivism of drunk driving for car and motorbike users, Mathematical Problems in Engineering, (2021), (1), 9065416.
- 7. Rahman, S., Weatherburn, D., (2021), Does prison deter drunk-drivers?, Journal of Quantitative Criminology, 37(4), 979-1001.
- 8. Zeithammer, R., Macinko, J., Silver, D., (2025), Assessing the deterrent effects of ignition interlock devices, American Journal of Preventive Medicine, 68(1), 137-144.
- 9. Fell, J. C., Scolese, J., (2021), The effectiveness of alcohol monitoring as a treatment for driving-while-intoxicated (dwi) offenders: A literature review and synthesis, Traffic Injury Prevention, 22(sup1), S1-S7.
- 10. Olson, A., (2025), The limitations of mouth alcohol detection systems in breath alcohol testing: Case reports, Forensic Science International: Synergy, 10, 100573.
- 11. Jaffe, D. H., Siman-Tov, M., Gopher, A., Peleg, K., (2013), Variability in the blood/breath alcohol ratio and implications for evidentiary purposes, Journal of Forensic Sciences, 58(5), 1233-1237.
- 12. Jones, A. W., (2025), Concentration units used to report blood-and breath-alcohol concentration for legal purposes are important to consider when blood-breath ratios of alcohol are calculated and compared between countries: re-evaluation of a German study with Alcotest 9510 DE evidential instrument, Canadian Society of Forensic Science Journal, 58(2), 40-51.
- 13. Cho, Y., Lee, W., Sin, H., Oh, S., Choi, K. C., Jun, J.-H., (2024), Non-invasive alcohol concentration measurement using a spectroscopic module: Outlook for the development of a drunk driving prevention system, Sensors, 24(7), 2252.
- 14. Brobbin, E., Deluca, P., Hemrage, S., Drummond, C., (2022), Accuracy of wearable transdermal alcohol sensors: Systematic review, Journal of Medical Internet Research, 24(4), e35178.
- 15. Gao, F., Liu, C., Zhang, L., Liu, T., Wang, Z., Song, Z., Cai, H., Fang, Z., Chen, J., Wang, J., (2023), Wearable and flexible electrochemical sensors for sweat analysis: A review, Microsystems & Nanoengineering, 9(1), 1.
- 16. Barba-Maza, L., Sánchez-López, C., (2016), Development of a breathalyzer for car drivers, Proceedings of the IEEE International Autumn Meeting on Power, Electronics and Computing. 1-4.
- 17. Bihar, E., Deng, Y., Miyake, T., Saadaoui, M., Malliaras, G. G., Rolandi, M., (2016), A disposable paper breathalyzer with an alcohol sensing organic electrochemical transistor, Scientific Reports, 6(1), 27582.
- 18. Finlayson, L., Barnard, I. R., McMillan, L., Ibbotson, S. H., Brown, C. T. A., Eadie, E., Wood, K., (2022), Depth penetration of light into skin as a function of wavelength from 200 to 1000 nm, Photochemistry and Photobiology, 98(4), 974-981.
- 19. Beć, K. B., Grabska, J., Huck, C. W., (2020), Near-infrared spectroscopy in bio-applications, Molecules, 25(12), 2948.
- 20. Vitorino, R., Barros, A. S., Guedes, S., Caixeta, D. C., Sabino-Silva, R., (2023), Diagnostic and monitoring applications using near infrared (NIR) spectroscopy in cancer and other diseases, Photodiagnosis and Photodynamic Therapy, 42, 103633.
- 21. Lin, L., He, H., Xue, R., Zhang, Y., Wang, Z., Nie, S., Ye, J., (2023), Direct and quantitative assessments of near-infrared light attenuation and spectroscopic detection depth in biological tissues using surface-enhanced raman scattering, Med-X, 1(1), 9.
- 22. Jin, X., Zhao, Z., Zhang, L., Yu, X., (2011), Determination of alcohol content in water alcohol hydrates using near-infrared spectroscopy and segmentation regression model, Transactions of the Institute of Measurement and Control, 33(5), 479-493.
- 23. Fajardo, C., Solarte, E., (2020), Optical properties of a simple model of soft biological tissue, Journal of Physics: Conference Series, 1547, 012005.
- 24. Bachir, W., (2022), Characterization of pasteurized milk in the near infrared range for construction of tissue-mimicking optical phantoms, Optical Materials: X, 14, 100154.
- 25. Ortega-Quijano, N., Fanjul-Vélez, F., Salas-García, I., Arce-Diego, J. L., (2011), Optical characterization of lipid-based tissue phantoms, Proceedings of the 21st International Conference Radioelektronika. 1-4.
Biography
- Min Seok Park
Master’s student in the Department of Biomedical
Engineering, Konkuk University.
His research interest is biomedical optics.
- Ye Chan Cho
Master’s student in the Department of Biomedical
Engineering, Konkuk University.
His research interest is biomedical optics.
- Min Seok Jeong
Undergraduate student in the Department of Biomedical Engineering, Konkuk University.
- Jae-Hoon Jun
Professor in the Department of Biomedical Engineering, Konkuk University. His research interest is biomedical optics.
Citations
Citations to this article as recorded by